
Gasgoo Munich- Data from Gasgoo Automotive Research Institute reveals that China's passenger vehicle and new energy vehicle (NEV) exports from January to February 2026 are characterized by "scale expansion and accelerating structural differentiation." On one hand, overall passenger vehicle exports remain anchored by markets like Russia, the UAE, and Brazil — a reflection of the stable volume driven by the price and channel advantages of internal combustion engine vehicles. On the other hand, NEV exports are clearly penetrating deeper into Europe and multiple global regions. With Brazil, the UK, and several European nations rising to the top ranks, the market distribution is becoming increasingly diverse.
Top 10 Destinations for China's Passenger Vehicle Exports (Jan–Feb 2026)
NO.1 Russia. In the first two months of 2026, passenger vehicle exports to Russia reached 108,392 units; February alone accounted for 108,392 units, representing a cumulative year-on-year increase of 97.2%.
NO.2 UAE. In the first two months of 2026, passenger vehicle exports to the UAE reached 103,926 units; February alone accounted for 103,926 units, representing a cumulative year-on-year increase of 53.0%.
NO.3 Brazil. In the first two months of 2026, passenger vehicle exports to Brazil reached 98,898 units; February alone accounted for 98,898 units, representing a cumulative year-on-year increase of 296.1%.
NO.4 UK. In the first two months of 2026, passenger vehicle exports to the UK reached 71,991 units; February alone accounted for 71,991 units, representing a cumulative year-on-year increase of 98.7%.
NO.5 Italy. In the first two months of 2026, passenger vehicle exports to Italy reached 48,327 units; February alone accounted for 48,327 units, representing a cumulative year-on-year increase of 114.9%.
NO.6 Belgium. In the first two months of 2026, passenger vehicle exports to Belgium reached 47,695 units; February alone accounted for 47,695 units, representing a cumulative year-on-year decrease of 1.0%.
NO.7 Saudi Arabia. In the first two months of 2026, passenger vehicle exports to Saudi Arabia reached 42,609 units; February alone accounted for 42,609 units, representing a cumulative year-on-year increase of 20.1%.
NO.8 Spain. In the first two months of 2026, passenger vehicle exports to Spain reached 42,476 units; February alone accounted for 42,476 units, representing a cumulative year-on-year increase of 70.3%.
NO.9 Australia. In the first two months of 2026, passenger vehicle exports to Australia reached 41,279 units; February alone accounted for 41,279 units, representing a cumulative year-on-year increase of 41.3%.
NO.10 Mexico. In the first two months of 2026, passenger vehicle exports to Mexico reached 31,548 units; February alone accounted for 31,548 units, representing a cumulative year-on-year decrease of 54.1%.
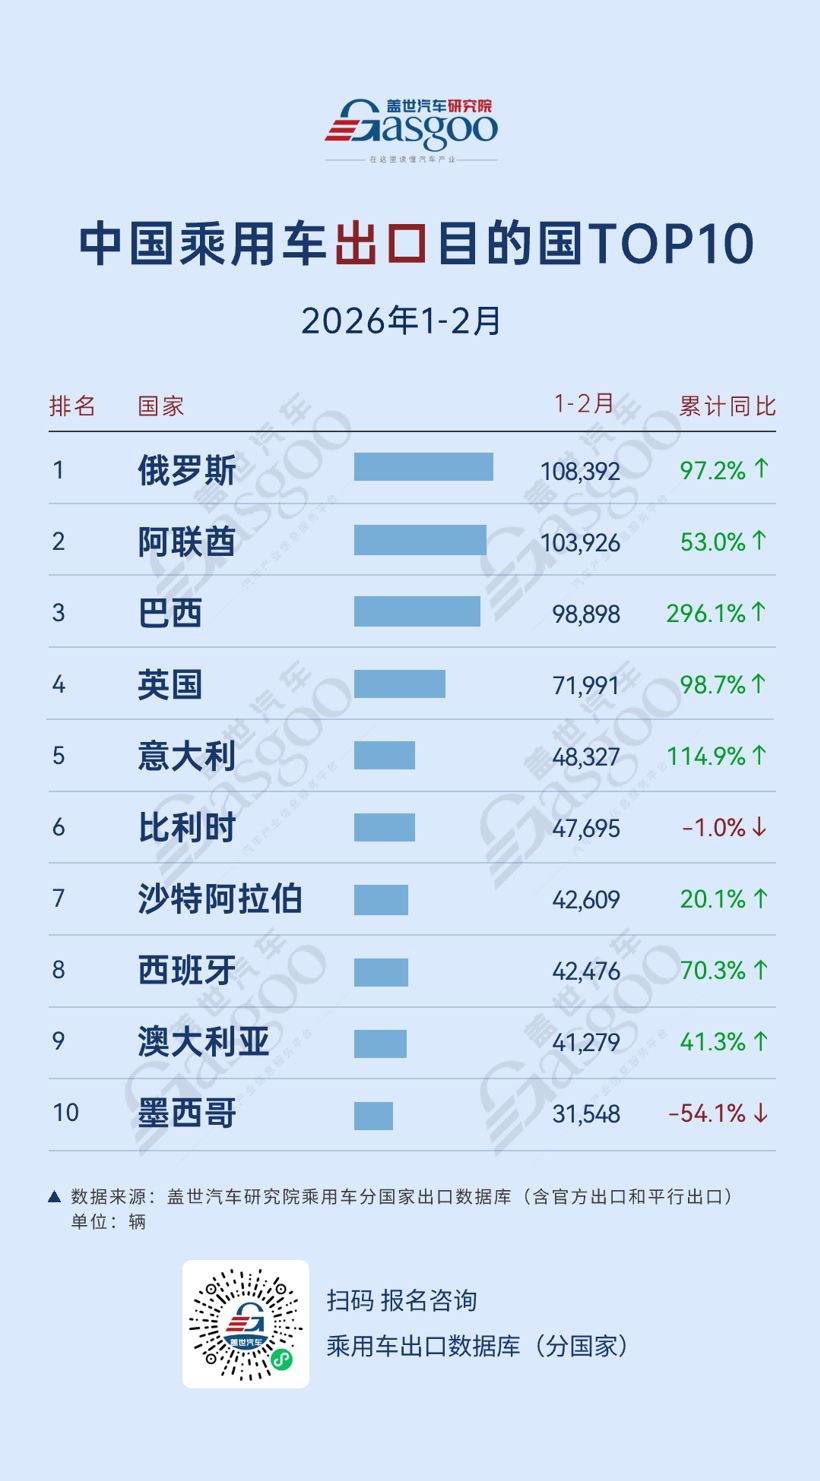
Looking at the distribution of destinations for China's passenger vehicle exports in the first two months of 2026, Russia (108,392 units), the UAE (103,926 units), and Brazil (98,898 units) claimed the top three spots, forming the core of the export volume. Leveraging cost advantages and rapid channel expansion, Chinese automakers continue to expand their market share — with Russia becoming the primary source of incremental growth amid shifting external conditions.
Meanwhile, the European market has demonstrated strong growth elasticity. The UK (71,991 units), Italy (48,327 units), and Spain (42,476 units) all posted high year-on-year growth rates, reflecting the steady progress of Chinese brands in introducing NEV products and building sales channels. However, a slight dip in Belgium (47,695 units) suggests that the European market remains influenced by policy environments, trade factors, and local competition. Overall growth carries some uncertainty, leaning more toward structural opportunities.
Latin America displays clear signs of divergence. Driven by policy windows and concentrated product launches, Brazil (98,898 units) achieved rapid growth, becoming a key source of incremental volume. Conversely, Mexico (31,548 units) saw a sharp decline — largely attributed to expectations of tariff increases in 2026, which pulled some export demand forward into late 2025. This trend suggests that Chinese automakers' success in Latin America remains highly dependent on specific national policy cycles and market environments.
The Middle East maintains a steady growth trajectory. Demand continues to release in the UAE (103,926 units) and Saudi Arabia (42,609 units), supported by purchasing power, policy environments, and established channel foundations. These markets are gradually shifting from supplementary roles to stable volume drivers. Overall, China's passenger vehicle exports are moving beyond reliance on a single market toward a phase of multi-regional coordination and structural optimization — where growth logic is evolving from simple scale expansion into a comprehensive competition of product, brand, and channel capabilities.
Top 10 Destinations for China's NEV Passenger Vehicle Exports (Jan–Feb 2026)
NO.1 Brazil. In the first two months of 2026, NEV passenger vehicle exports to Brazil reached 76,446 units; February alone accounted for 76,446 units, representing a cumulative year-on-year increase of 398.1%.
NO.2 UK. In the first two months of 2026, NEV passenger vehicle exports to the UK reached 51,249 units; February alone accounted for 51,249 units, representing a cumulative year-on-year increase of 139.9%.
NO.3 UAE. In the first two months of 2026, NEV passenger vehicle exports to the UAE reached 46,953 units; February alone accounted for 46,953 units, representing a cumulative year-on-year increase of 187.9%.
NO.4 Belgium. In the first two months of 2026, NEV passenger vehicle exports to Belgium reached 45,710 units; February alone accounted for 45,710 units, representing a cumulative year-on-year decrease of 0.8%.
NO.5 Italy. In the first two months of 2026, NEV passenger vehicle exports to Italy reached 29,159 units; February alone accounted for 29,159 units, representing a cumulative year-on-year increase of 564.1%.
NO.6 Australia. In the first two months of 2026, NEV passenger vehicle exports to Australia reached 23,399 units; February alone accounted for 23,399 units, representing a cumulative year-on-year increase of 101.9%.
NO.7 Spain. In the first two months of 2026, NEV passenger vehicle exports to Spain reached 22,772 units; February alone accounted for 22,772 units, representing a cumulative year-on-year increase of 107.8%.
NO.8 Germany. In the first two months of 2026, NEV passenger vehicle exports to Germany reached 22,624 units; February alone accounted for 22,624 units, representing a cumulative year-on-year increase of 289.0%.
NO.9 South Korea. In the first two months of 2026, NEV passenger vehicle exports to South Korea reached 17,325 units; February alone accounted for 17,325 units, representing a cumulative year-on-year increase of 213.3%.
NO.10 Indonesia. In the first two months of 2026, NEV passenger vehicle exports to Indonesia reached 15,884 units; February alone accounted for 15,884 units, representing a cumulative year-on-year increase of 57.2%.
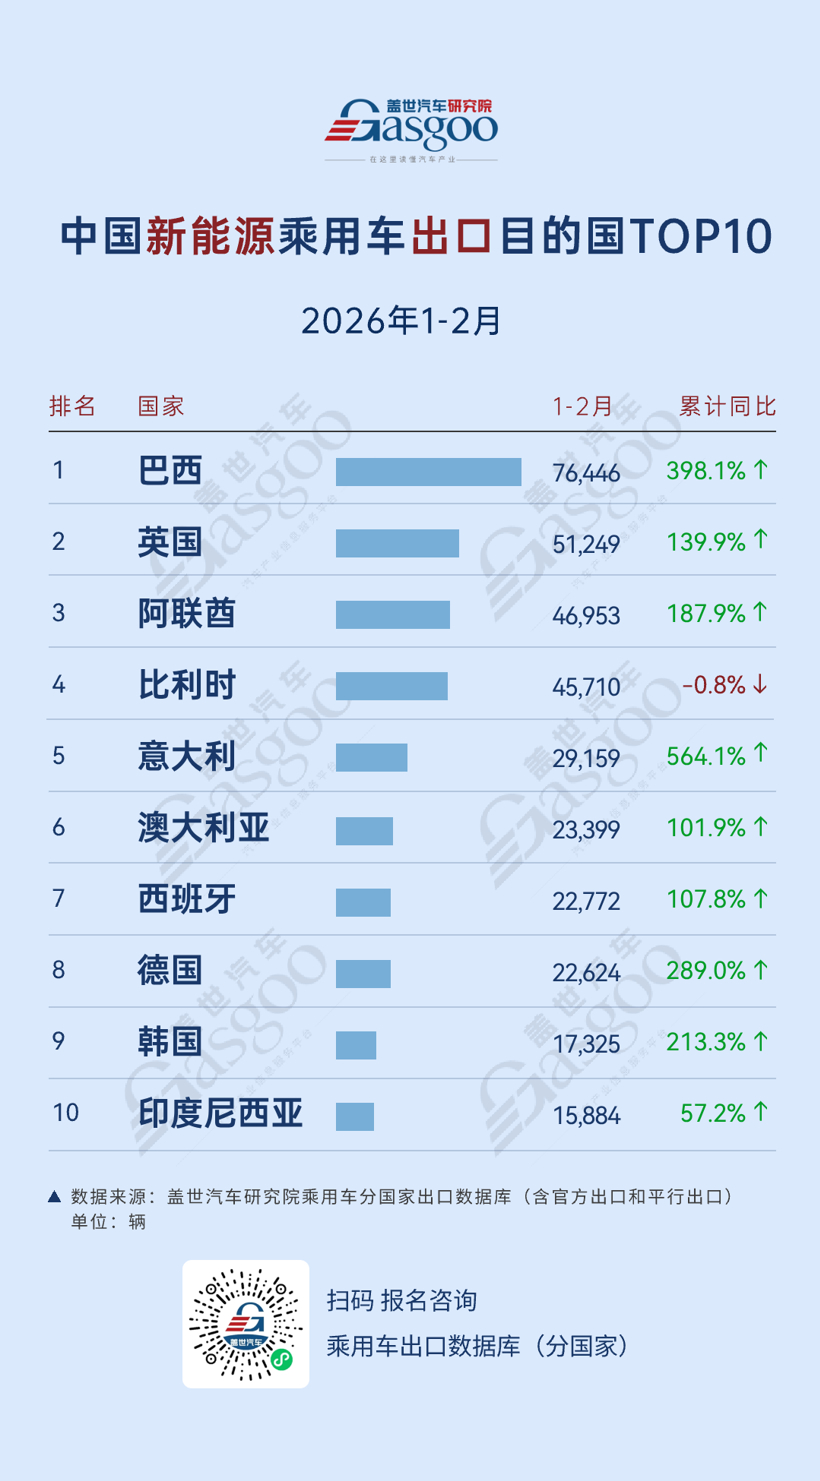
Looking at destinations for China's NEV passenger vehicle exports in the first two months of 2026, Brazil (76,446 units), the UK (51,249 units), and the UAE (46,953 units) form the leading tier. Unlike traditional internal combustion engine exports, NEV models have achieved a relatively balanced layout between emerging and developed markets — rapidly scaling up in high-growth markets like Brazil while steadily penetrating mature ones like the UK.
Europe's status in NEV exports is on the rise. The UK (51,249 units), Belgium (45,710 units), Italy (29,159 units), Spain (22,772 units), and Germany (22,624 units) all made the top ten. This is driven by Europe's accelerated electrification transition, temporary local supply shortages, and the cost and product advantages of Chinese pure-electric models. Yet, the slight decline in Belgium (45,710 units) reflects ongoing volatility in the European market due to shifting policies, subsidies, and trade environments.
In terms of growth velocity, emerging markets and select European nations are seeing rapid expansion. Italy (29,159 units) surged 564.1%, Brazil (76,446 units) jumped 398.1%, Germany (22,624 units) climbed 289.0%, and South Korea (17,325 units) rose 213.3% — all underscoring the accelerated penetration of NEV models across different regions.
Asia-Pacific and Middle East markets continue to expand steadily. Australia (23,399 units), South Korea (17,325 units), and Indonesia (15,884 units) all achieved rapid growth, while the UAE (46,953 units) sustained its volume momentum. This suggests that NEVs are gradually transitioning from "policy-driven markets" to "demand-driven markets," establishing replicable growth paths in more regions.