


Gasgoo Munich- Data from Gasgoo Automotive Institute shows that Chinese passenger vehicle and new-energy vehicle (NEV) exports maintained a high-growth trajectory in the first quarter of 2026. This was marked by a further optimized and increasingly diversified regional structure. On one hand, exports remain anchored by core markets such as Russia, Brazil, and the UK—each surpassing 100,000 units. Russia led with 187,000 units, capitalizing on supply gaps and established distribution channels to achieve sustained, robust volume growth. On the other hand, NEV exports are penetrating deeper into Europe and multiple global regions. Brazil rose to prominence with 127,000 units, a 271.1% year-on-year jump. European nations, including the UK, Belgium, Italy, Germany, and Spain, all ranked in the top ten. This reflects a more diversified market distribution and underscores the core competitiveness of Chinese new-energy vehicles in high-barrier markets.
Top 10 Destinations for China's Passenger Vehicle Exports (Q1 2026)
NO.1 Russia: Exports to Russia reached 186,765 units in Q1 2026, up 97.1% year-on-year.
NO.2 Brazil: Exports to Brazil reached 166,787 units in Q1 2026, up 242.8% year-on-year.
NO.3 UK: Exports to the UK reached 108,827 units in Q1 2026, up 115.7% year-on-year.
NO.4 UAE: Exports to the UAE reached 107,323 units in Q1 2026, up 5.6% year-on-year.
NO.5 Belgium: Exports to Belgium reached 80,111 units in Q1 2026, up 18.7% year-on-year.
NO.6 Italy: Exports to Italy reached 71,333 units in Q1 2026, up 108.3% year-on-year.
NO.7 Australia: Exports to Australia reached 63,644 units in Q1 2026, up 31.4% year-on-year.
NO.8 Mexico: Exports to Mexico reached 60,408 units in Q1 2026, down 44.7% year-on-year.
NO.9 Spain: Exports to Spain reached 55,583 units in Q1 2026, up 54.5% year-on-year.
NO.10 Saudi Arabia: Exports to Saudi Arabia reached 51,928 units in Q1 2026, down 7.0% year-on-year.
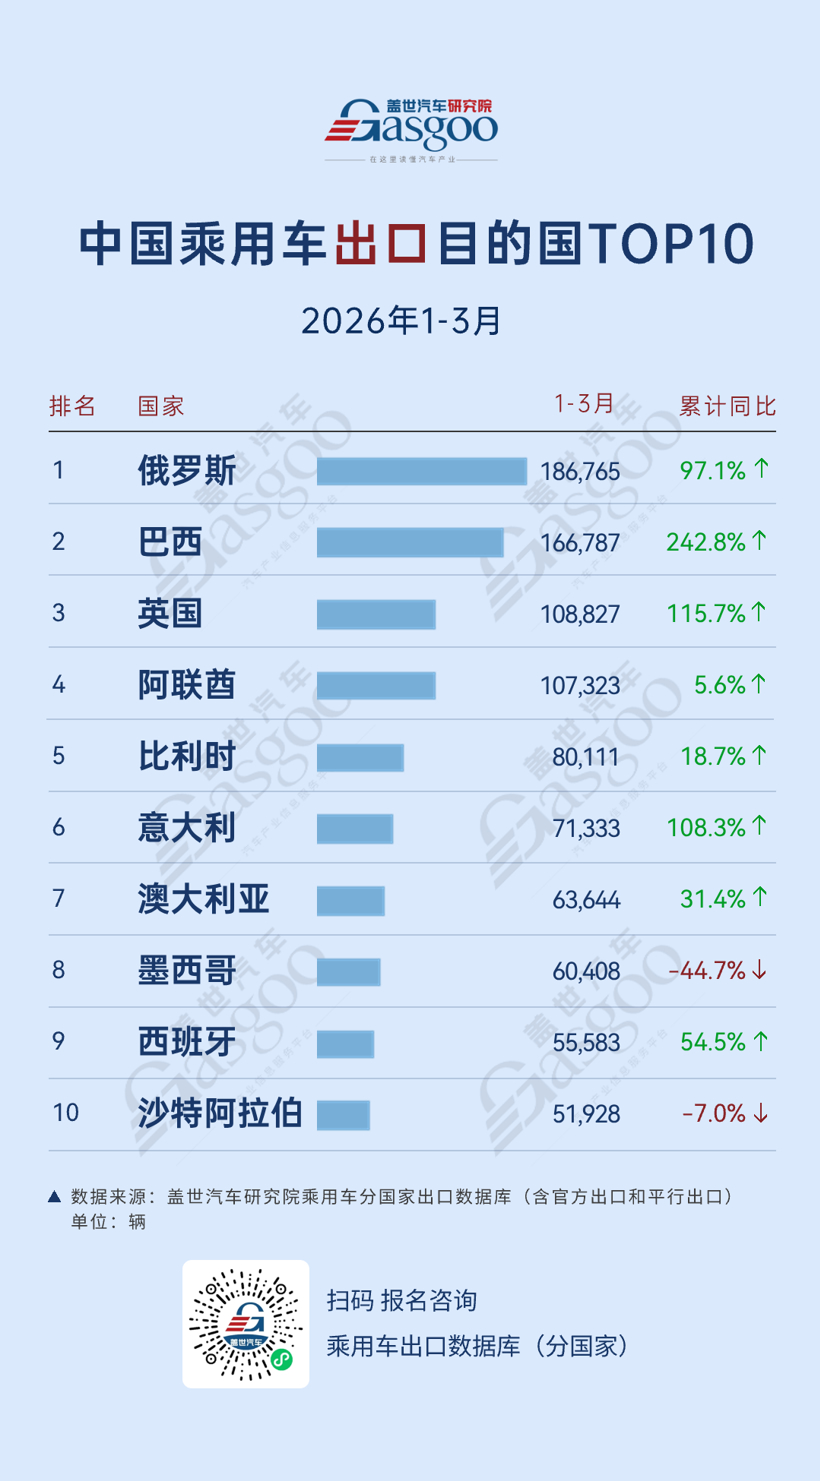
In terms of distribution for Q1 2026, Russia (186,765 units), Brazil (166,787 units), and the UK (108,827 units) ranked as the top three destinations, forming the core of export volume. The Russian market continues to benefit from supply shortages created by the shifting external landscape, with Chinese automakers further consolidating their lead through product adaptability and deeper channel penetration.
Meanwhile, the European market is showing a steady growth trend. The UK (108,827 units), Belgium (80,111 units), Italy (71,333 units), and Spain (55,583 units) all posted high year-on-year growth rates. This reflects the continued rollout of new-energy products and channel expansion by Chinese brands, leading to an overall increase in market share. However, growth in Europe remains influenced by policy environments, trade factors, and local competitive landscapes, leaving future expansion with some uncertainty and leaning toward structural opportunities.
The Latin American market is showing clear polarization. Brazil surged to second place with 166,787 units, a 242.8% annual increase, while exports to Mexico slumped 44.7%. The decline in Mexico is partly attributed to tariff policy changes and demand front-loading in late 2025. This divergence suggests that the development of Chinese automakers in Latin America remains highly dependent on specific national policy cycles and market environments.
Additionally, the two major Middle Eastern markets have entered a period of adjustment. The UAE (107,323 units) saw only a slight increase of 5.6%, while Saudi Arabia (51,928 units) fell 7.0%, marking an end to the previous high-growth phase. Despite a solid consumption base and established networks, growth has slowed noticeably due to oil price volatility and intensifying regional competition. Overall, Chinese passenger vehicle exports are shifting from reliance on a few hot spots to a new stage characterized by multi-regional contribution and increasing diversification. The growth driver is also transitioning from sheer volume expansion to a deeper contest of product strength and brand recognition.
Top 10 Destinations for China's New-Energy Passenger Vehicle Exports (Q1 2026)
NO.1 Brazil: Exports to Brazil reached 127,001 units in Q1 2026, up 271.1% year-on-year.
NO.2 Belgium: Exports to Belgium reached 77,517 units in Q1 2026, up 20.5% year-on-year.
NO.3 UK: Exports to the UK reached 74,840 units in Q1 2026, up 130.9% year-on-year.
NO.4 UAE: Exports to the UAE reached 47,581 units in Q1 2026, up 109.8% year-on-year.
NO.5 Italy: Exports to Italy reached 42,251 units in Q1 2026, up 615.1% year-on-year.
NO.6 Germany: Exports to Germany reached 39,181 units in Q1 2026, up 350.9% year-on-year.
NO.7 Australia: Exports to Australia reached 37,659 units in Q1 2026, up 96.8% year-on-year.
NO.8 Spain: Exports to Spain reached 31,853 units in Q1 2026, up 102.0% year-on-year.
NO.9 South Korea: Exports to South Korea reached 29,757 units in Q1 2026, up 371.0% year-on-year.
NO.10 Thailand: Exports to Thailand reached 24,018 units in Q1 2026, up 11.2% year-on-year.
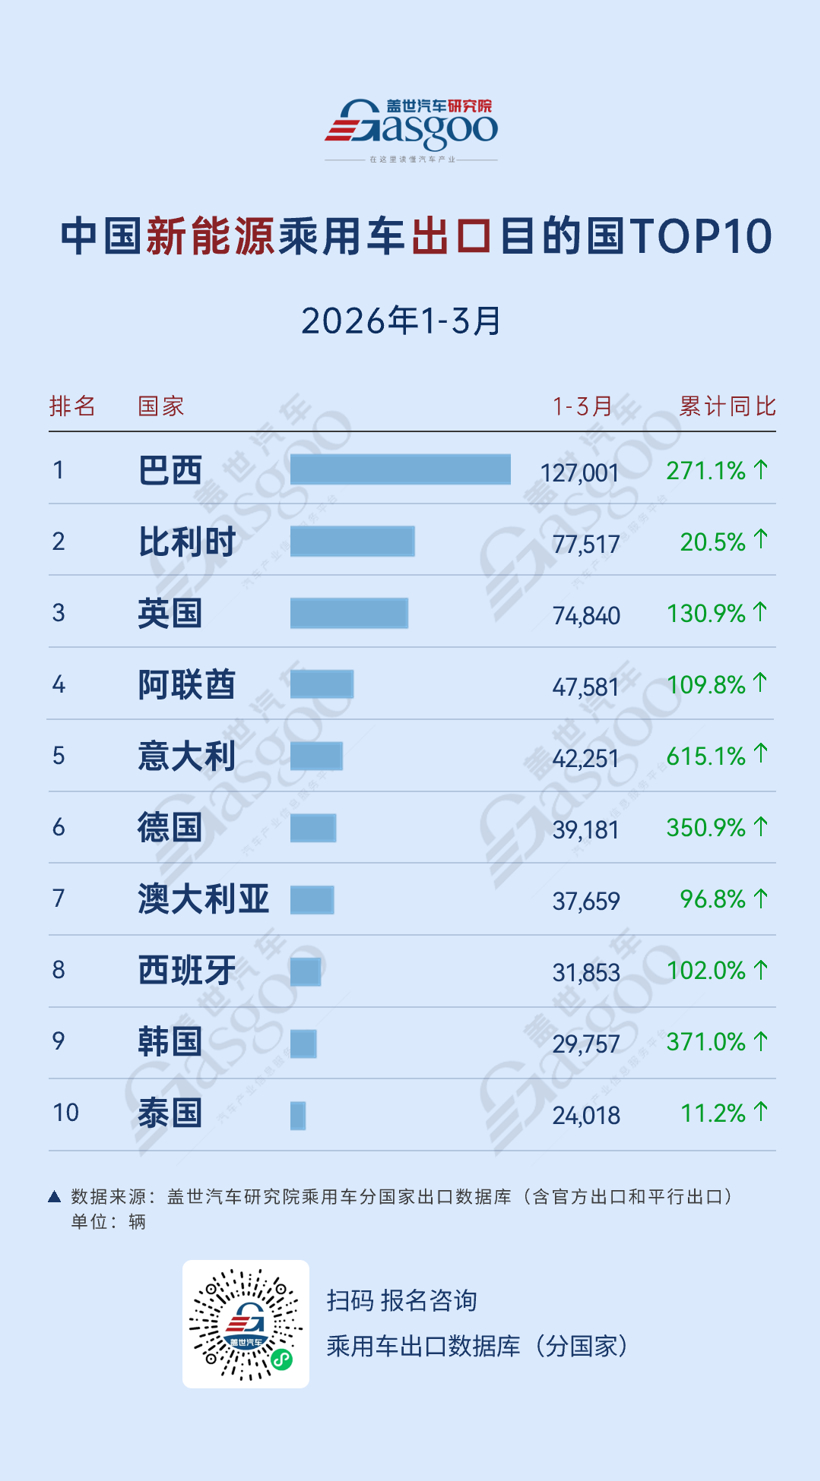
Looking at the destinations for China's new-energy passenger vehicle exports in Q1 2026, Brazil ranked first with 127,001 units, surging 271.1% and becoming a core growth engine. Belgium and the UK followed in second and third place with 77,517 and 74,840 units, respectively. The UK maintained high-speed growth at 130.9%. Meanwhile, Belgium, as a key European transit hub, sustained a large export volume with a stable base despite a slower growth rate of 20.5%.
In terms of regional distribution, Europe's position in the landscape of Chinese NEV exports has further solidified. Belgium (77,517 units), the UK (74,840 units), Italy (42,251 units), Germany (39,181 units), and Spain (31,853 units) all made the top ten. This is primarily driven by accelerated electrification in Europe, periodic local supply shortages, and the cost and product advantages of Chinese pure-electric models.
The Middle East and Asia-Pacific markets showed divergent trends. The UAE ranked fourth with 47,581 units and a 109.8% increase. It benefited from the region's green transition, rising demand for new-energy vehicles amid high oil prices, and the continued volume release of premium Chinese NEV brands. Australia (37,659 units) grew 96.8%, maintaining its EV-friendly stance. South Korea (29,757 units) saw rapid growth of 371.0%, indicating that Chinese NEVs are leveraging product strength to challenge established patterns in neighboring East Asian markets. In contrast, Thailand (24,018 units) grew only 11.2%; while relatively flat, it maintained a stable export scale due to a high base and the strong market share of Chinese brands.
Overall, the core highlight of China's NEV exports in the first quarter of 2026 was the coexistence of high speed and broad coverage. The market featured rapid growth in countries like Brazil, Italy, Germany, and South Korea, alongside steady support from nations like Belgium and Thailand. The synchronized momentum across Europe, emerging markets, and the Asia-Pacific and Middle East regions demonstrates the comprehensive global competitiveness of Chinese new-energy vehicles, laying a solid foundation for sustained export growth.

— Recommended: 2026 Chinese Automaker Overseas Layout Map —
Click image for details


