


Gasgoo Munich- Following the Chinese New Year, China's auto industry saw a pickup in production and business activity, with overall market momentum improving in March. While both output and sales rebounded sharply from February, they remained slightly lower than a year earlier, though conditions improved compared with the first two months of the year.
Domestic demand continued to lag, weighed down by policy transitions, earlier consumption pull-forward, and a high comparison base, resulting in double-digit year-on-year declines. In contrast, exports maintained strong growth and resilience despite global uncertainties, highlighting the rising competitiveness of Chinese automakers.
Data from the China Association of Automobile Manufacturers (CAAM) show that both production and sales declined modestly in the first quarter, but the pace of contraction narrowed compared with the January–February period, signaling a gradual recovery. Passenger vehicle declines eased, commercial vehicle sales continued to grow, and demand for new energy vehicles remained robust, while exports expanded rapidly.
Looking ahead to the second quarter, policymakers expect stimulus measures—such as programs promoting equipment upgrades and consumer trade-ins—to continue supporting demand. The upcoming Beijing auto show is also set to trigger a wave of new model launches, which could further boost market sentiment.

However, the industry still faces considerable headwinds. A volatile external environment, rising geopolitical risks, and persistently high raw material and component costs are increasing operational pressures. At the same time, domestic demand remains relatively weak. Authorities and industry stakeholders are expected to focus on managing external risks, stimulating consumption, and curbing excessive price competition to ensure stable market development.
Overall vehicle production and sales
In March, China produced 2.917 million vehicles and sold 2.899 million units, representing month-on-month increases of 74.4% and 60.6%, respectively. On a year-on-year basis, production fell 3% and sales declined 0.6%.
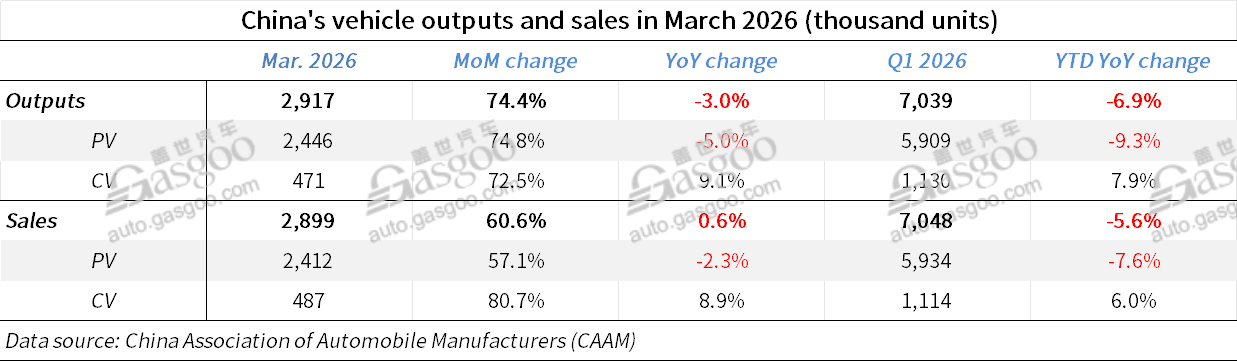
For the first quarter, total vehicle production reached 7.039 million units and sales came in at 7.048 million units, down 6.9% and 5.6% year-on-year, respectively.
Domestic vehicle market performance
Domestic vehicle sales totaled 2.024 million units in March, rising 78.6% from February but falling 16% year-on-year. Within this, traditional internal combustion engine vehicles accounted for 1.142 million units, up 75.8% month-on-month but down 14.1% from a year earlier.
Over the first three months, domestic sales reached 4.823 million units, representing a 20.3% decline year-on-year. Sales of conventional fuel vehicles totaled 2.817 million units, down 17.6%.
Export performance
Vehicle exports reached 875,000 units in March, increasing 30.2% from February and surging 72.7% year-on-year.
In the first quarter, exports totaled 2.226 million units, up 56.7% compared with the same period last year.
Breaking this down, new energy vehicle (NEV) exports hit 371,000 units in March, up 31.6% month-on-month and 1.3 times higher year-on-year. Exports of traditional oil-fueled vehicles reached 505,000 units, rising 29.2% month-on-month and 44.6% year-on-year.
From January to March, NEV exports totaled 954,000 units, up 1.2 times year-on-year, while oil-fueled vehicle exports reached 1.271 million units, up 29.9%.
Passenger vehicle segment
Passenger vehicle production stood at 2.446 million units in March, with sales at 2.412 million units. This represents month-on-month surges of 74.8% and 57.1%, respectively, while declining 5.0% and 2.3% year-on-year.
For the first quarter, production reached 5.909 million units and sales totaled 5.934 million units, down 9.3% and 7.6%, respectively.
Chinese brand performance and market structure
Chinese-brand passenger vehicles continued to dominate the market. In March, sales reached 1.632 million units, up 0.2% year-on-year, accounting for 67.7% of total passenger vehicle sales—an increase of 1.7 percentage points from a year earlier.
In the first quarter, China's self-owned brands sold 4.039 million units, down 7.6% year-on-year, with a market share of 68.1%, unchanged from the same period last year.
Within the traditional oil-fuel passenger vehicle segment, sales across A- to C-class vehicles declined to varying degrees in the first quarter, with demand still concentrated in the A-class segment, which recorded 1.765 million units, down 6% year-on-year.
In the NEV segment, sales of A00- and A-segment models declined, with the entry-level A00 segment most affected by policy changes. Demand shifted toward the B-segment segment, which recorded 849,000 units in cumulative sales, up 8.1% year-on-year.
From a pricing perspective, both conventional and new energy passenger vehicles remained concentrated in the RMB 100,000–150,000 range.
Sales of traditional oil-fueled vehicles in this band reached 1.014 million units in the first quarter, down 6.1% year-on-year.
In contrast, new energy passenger vehicle sales in the same price range totaled 617,000 units, increasing 6.8% from a year earlier, reflecting continued consumer migration toward electrified models in the mass-market segment.
Domestic passenger vehicle sales performance
In March, China's domestic passenger vehicle sales reached 1.663 million units, surging 75.1% from February but falling 19.2% year-on-year.
Sales of conventional oil-fueled passenger vehicles totaled 867,000 units, a decrease of 182,000 units from the same period last year, representing a 17.3% year-on-year decline despite a 71.5% month-on-month rebound.
For the first quarter, domestic passenger vehicle sales stood at 4.013 million units, down 23.4% year-on-year. Within this, traditional oil-fueled vehicle sales fell to 2.192 million units, marking a reduction of 565,000 units, or a 20.5% decline compared with a year earlier.
Passenger vehicle exports
In contrast, passenger vehicle exports continued to accelerate sharply. March exports reached 748,000 units, increasing 27.8% month-on-month and surging 82.4% year-on-year.
Over the January–March period, passenger vehicle exports totaled 1.921 million units, up 63% from the previous year.
Overall commercial vehicle production and sales
The commercial vehicle segment showed relative resilience. In March, production reached 471,000 units and sales totaled 487,000 units, rising 72.5% and 80.7% month-on-month, respectively, while growing 9.1% and 8.9% year-on-year.
Natural gas-powered commercial vehicles stood out, with March sales hitting 35,000 units—up 1.7 times from February and 21.1% higher than a year earlier.
In the first quarter, commercial vehicle production and sales reached 1.13 million and 1.114 million units, representing year-on-year increases of 7.9% and 6.0%, respectively. Natural gas vehicle sales totaled 71,000 units, up 9.2%.
Domestic commercial vehicle sales performance
Domestic demand for commercial vehicles improved modestly. Sales reached 360,000 units in March, nearly doubling from the previous month with a 97.1% increase, and rising 2.7% year-on-year.
For the first quarter, domestic commercial vehicle sales totaled 810,000 units, remaining broadly flat with marginal growth of 0.03%.
Commercial vehicle exports
Commercial vehicle exports also maintained solid growth momentum. March exports reached 127,000 units, up 46% from February and 31.4% year-on-year.
Cumulative exports for the first quarter stood at 305,000 units, marking a 26% increase compared with the same period last year.
New energy vehicle production and sales
China's NEV sector showed mixed performance in March. Production reached 1.231 million units, down 3.6% year-on-year, while sales rose slightly by 1.2% to 1.252 million units. NEVs accounted for 43.2% of total new vehicle sales during the month.
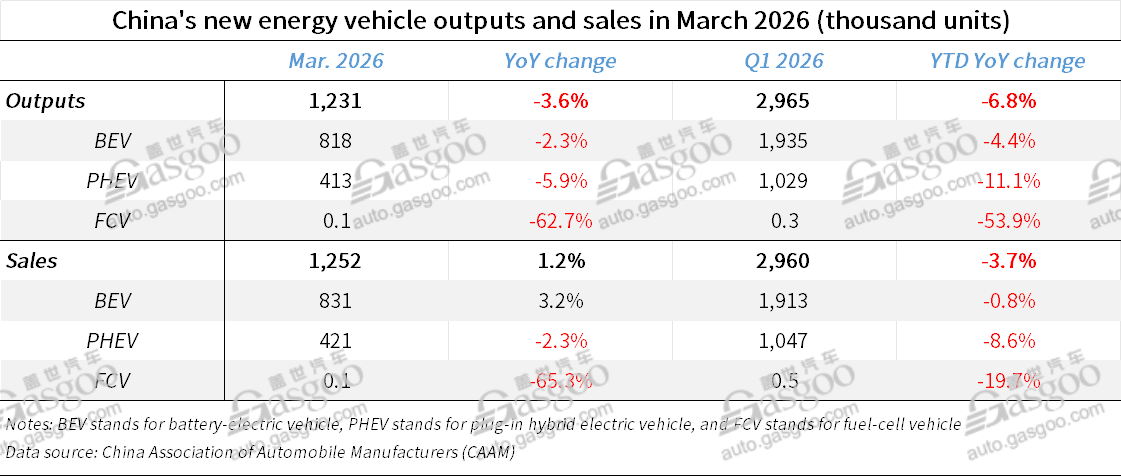
In the first quarter, NEV production and sales totaled 2.965 million and 2.96 million units, down 6.8% and 3.7% year-on-year, respectively. NEVs represented 42% of all new vehicle sales.
Domestic new energy vehicle sales performance
Despite strong monthly recovery, domestic NEV sales remained under pressure on a yearly basis. March domestic NEV sales reached 882,000 units, up 82.4% month-on-month but down 18.3% year-on-year.
Passenger NEVs accounted for 796,000 units, rising 79.1% from February but declining 21.1% annually, while NEV commercial vehicles bucked the trend, increasing 21.7% year-on-year to 85,000 units after a 1.2-fold month-on-month jump.
For the first quarter, domestic NEV sales totaled 2.006 million units, down 23.8%. Passenger NEVs fell 26.7% to 1.822 million units, while NEV commercial vehicles rose 23.6% to 184,000 units.
NEVs accounted for 43.6% of domestic vehicle sales in March. Within this, NEV penetration reached 47.9% in the passenger vehicle segment and 23.6% in commercial vehicles.
For the January–March period, NEVs represented 41.6% of domestic sales overall, with penetration rates of 45.4% in passenger vehicles and 22.7% in commercial vehicles.
New energy vehicle exports
NEV exports continued to post strong growth. In March, NEV exports reached 371,000 units, up 31.6% month-on-month and 1.3 times higher year-on-year.
Passenger NEVs dominated, with 363,000 units exported, rising 1.4 times year-on-year, while NEV commercial vehicle exports stood at 7,000 units, declining 19.6% year-on-year despite a 42.9% month-on-month increase.
In the first quarter, total NEV exports reached 954,000 units, up 1.2 times year-on-year. Passenger NEVs accounted for 935,000 units, while commercial NEV exports fell 16.2% over a year earlier to 19,000 units.
Breaking down NEV exports, battery electric vehicles (BEVs) accounted for 217,000 units in March, up 24.6% month-on-month and 1.1 times year-on-year. Plug-in hybrid electric vehicles (PHEVs) performed even more strongly, with exports of 153,000 units, rising 43.1% month-on-month and 1.8 times from a year earlier.
From January to March, BEV exports reached 594,000 units, up 1.1 times year-on-year, while PHEV exports totaled 360,000 units, increasing 1.4 times from the year-ago period.
Sales performance of key automobile groups
Market concentration among leading automakers remained high. The top 15 automobile groups recorded combined sales of 6.582 million units in the first quarter, down 6% year-on-year and accounting for 93.4% of total vehicle sales, a slight decline of 0.4 percentage points from the previous year.
In the NEV segment, the top 15 groups sold a combined 2.856 million units, down 4.2% year-on-year, representing 96.5% of total NEV sales, 0.5 percentage points lower than a year earlier.
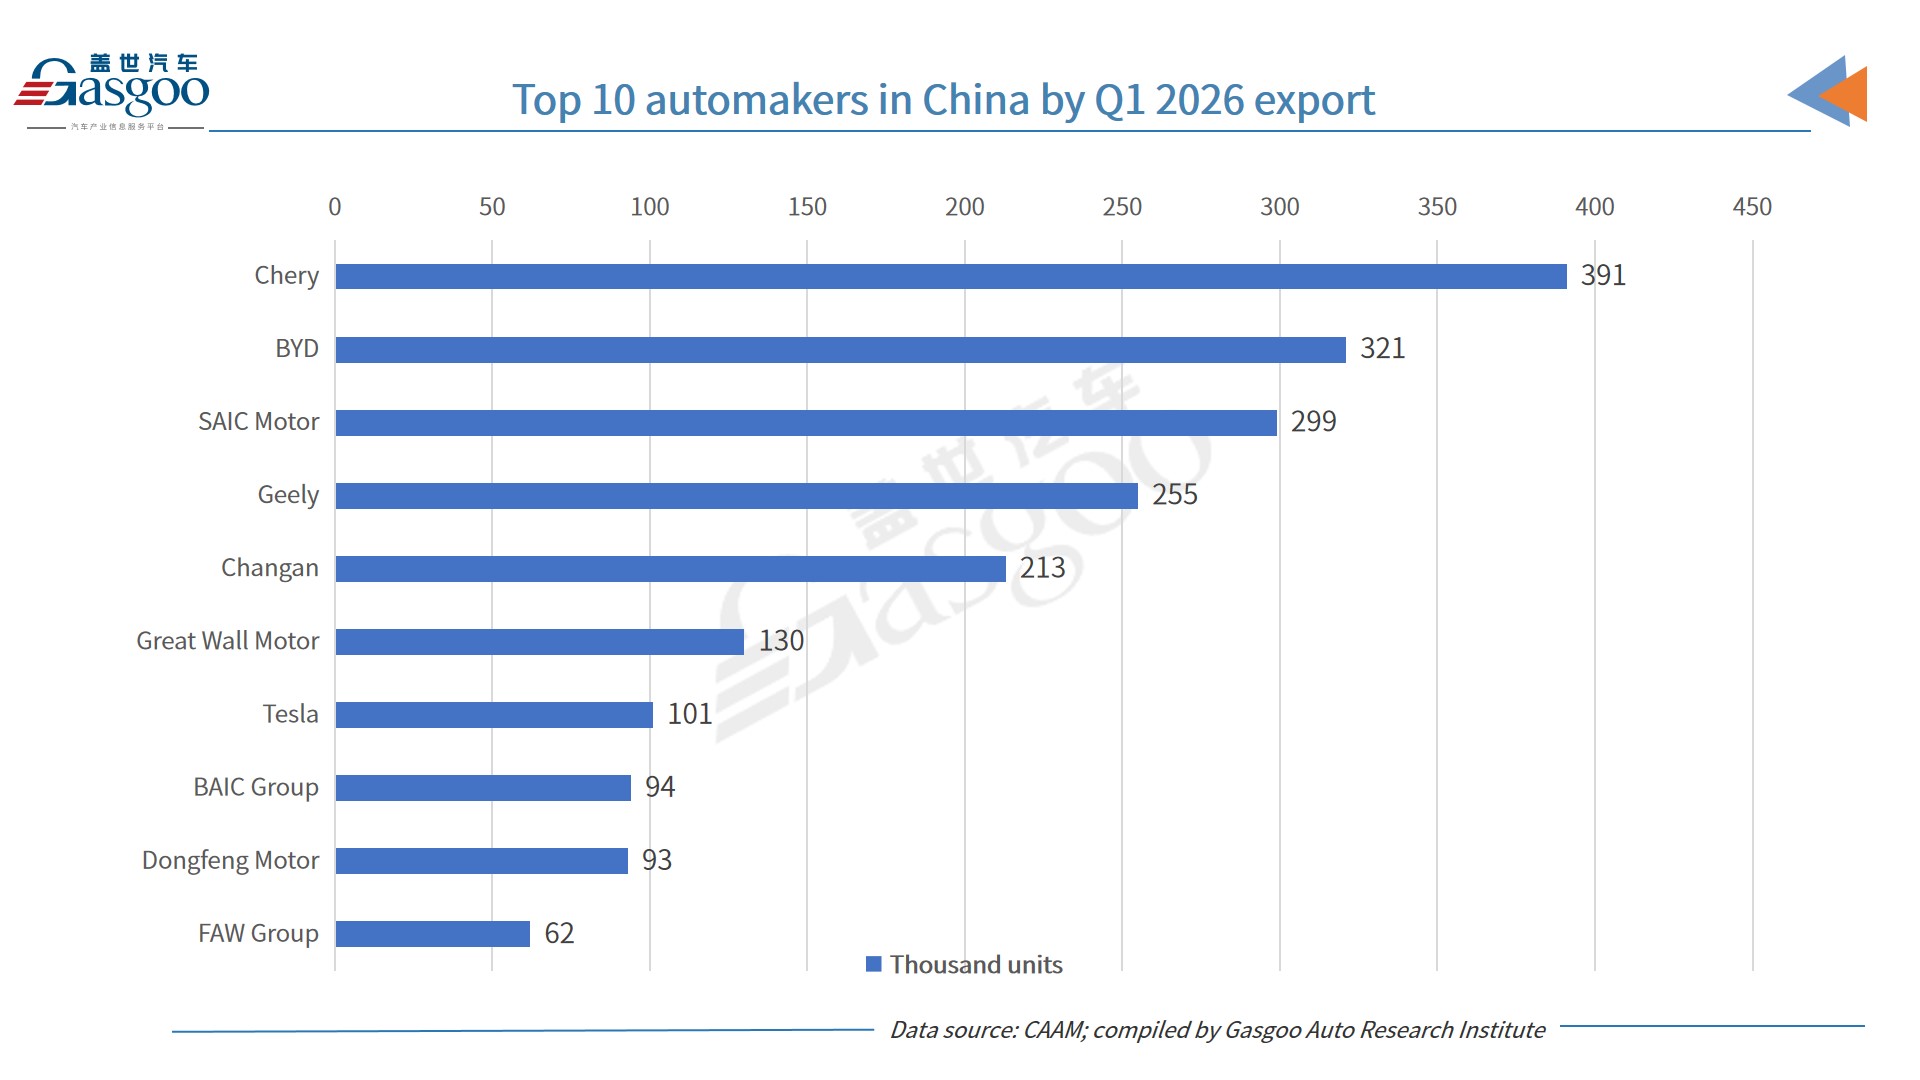
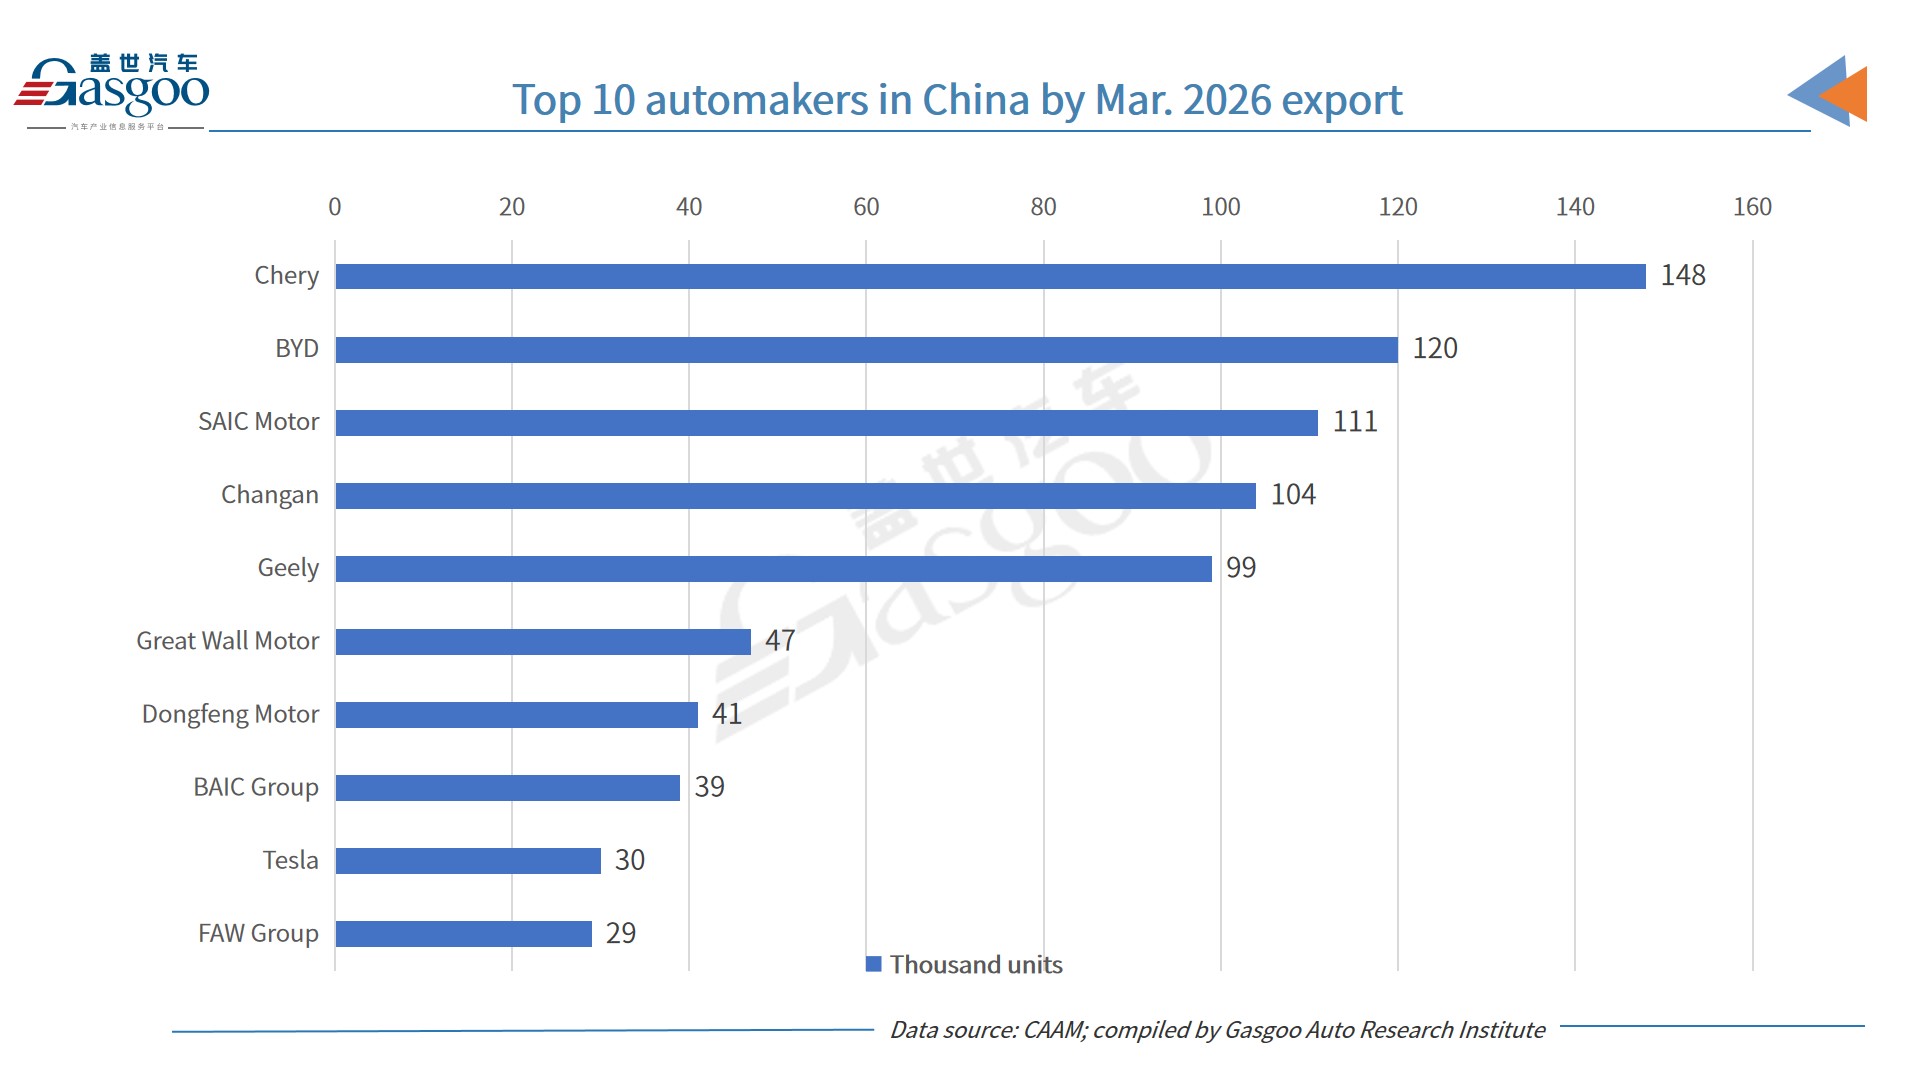
Performance of key exporters
Among leading exporters, Chery continued to dominate outbound shipments. In March, the company exported 148,000 vehicles, up 71.3% year-on-year and accounting for 16.9% of total exports. Tesla recorded the fastest growth rate among the top exporters, with shipments reaching 30,000 units, surging 5.3 times from a year earlier.
For the first quarter, Chery exported 391,000 vehicles, an increase of 54.4%, representing 17.6% of total exports. Tesla again posted the strongest growth, with exports totaling 101,000 units, up 1.6 times year-on-year.


