


According to data from #Gasgoo Auto Research Institute, the core electrification segments of China's new energy vehicle market entered a phase in 2025 defined by large-scale application and accelerating structural differentiation. Installation volumes for key areas—such as drive motors, motor controllers, multi-in-one drive systems, and power devices—continue to expand, while market concentration rises. Differences among companies in building self-supply systems, third-party capabilities, and system integration paths are becoming increasingly distinct. This data offers a crucial window into the competitive landscape, technological evolution, and industrial collaboration within China's EV electrification sector.
Power Battery Supplier Installation Rankings
CATL, Jan–Dec 2025 installation 235,088 MWh, market share 41.6%.
FinDreams Battery, Jan–Dec 2025 installation 144,864 MWh, market share 25.6%.
CALB, Jan–Dec 2025 installation 36,587 MWh, market share 6.5%.
Gotion High-tech, Jan–Dec 2025 installation 29,015 MWh, market share 5.1%.
SVOLT, Jan–Dec 2025 installation 18,122 MWh, market share 3.2%.
ZENERGY, Jan–Dec 2025 installation 18,050 MWh, market share 3.2%.
Sunwoda, Jan–Dec 2025 installation 14,401 MWh, market share 2.5%.
LG Energy Solution, Jan–Dec 2025 installation 13,604 MWh, market share 2.4%.
Jiyao Tongxing, Jan–Dec 2025 installation 13,386 MWh, market share 2.4%.
EVE Energy, Jan–Dec 2025 installation 11,608 MWh, market share 2.1%.
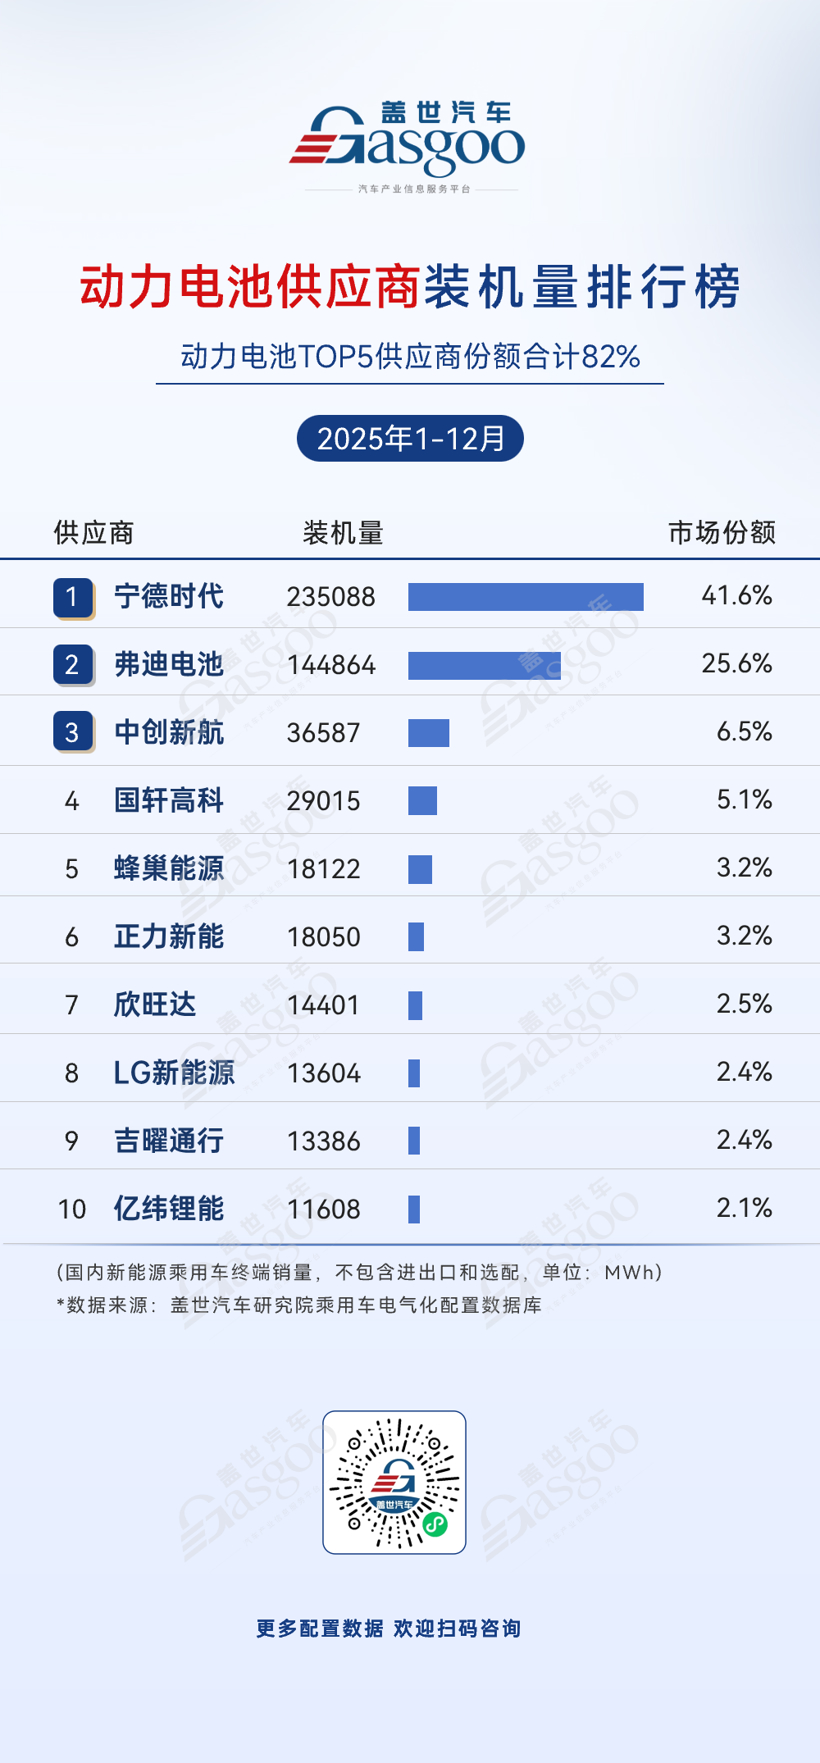
Looking at the Jan–Dec 2025 power battery installation data, the domestic market shows a landscape dominated by a duopoly, marked by high concentration and absolute leadership by local enterprises. The top five suppliers command a combined 82% share, pushing industry concentration even higher. CATL holds the top spot with a 41.6% share and 235,088 MWh installed, remaining the industry benchmark thanks to its advantages in technology iteration, production capacity, and global supply capabilities. FinDreams Battery follows closely with a 25.6% share and 144,864 MWh, its vertical integration with BYD fueling strong growth momentum. Local players like CALB, Gotion High-tech, and SVOLT trail the leaders, engaging in differentiated competition, while international giants like LG Energy Solution have seen their market share significantly compressed—highlighting the core competitiveness of domestic supply chains in cost control and response speed.
Battery PACK Supplier Installation Rankings
FinDreams Battery, Jan–Dec 2025 installation 3,752,265 sets, market share 30.1%.
CATL, Jan–Dec 2025 installation 2,535,387 sets, market share 20.3%.
Tesla, Jan–Dec 2025 installation 626,989 sets, market share 5.0%.
REPT, Jan–Dec 2025 installation 617,054 sets, market share 5.0%.
Gotion High-tech, Jan–Dec 2025 installation 601,000 sets, market share 4.8%.
CALB, Jan–Dec 2025 installation 588,791 sets, market share 4.7%.
Shanju Battery, Jan–Dec 2025 installation 569,268 sets, market share 4.6%.
SVOLT, Jan–Dec 2025 installation 465,464 sets, market share 3.7%.
Leapmotor, Jan–Dec 2025 installation 339,553 sets, market share 2.7%.
Sunwoda, Jan–Dec 2025 installation 224,865 sets, market share 1.8%.
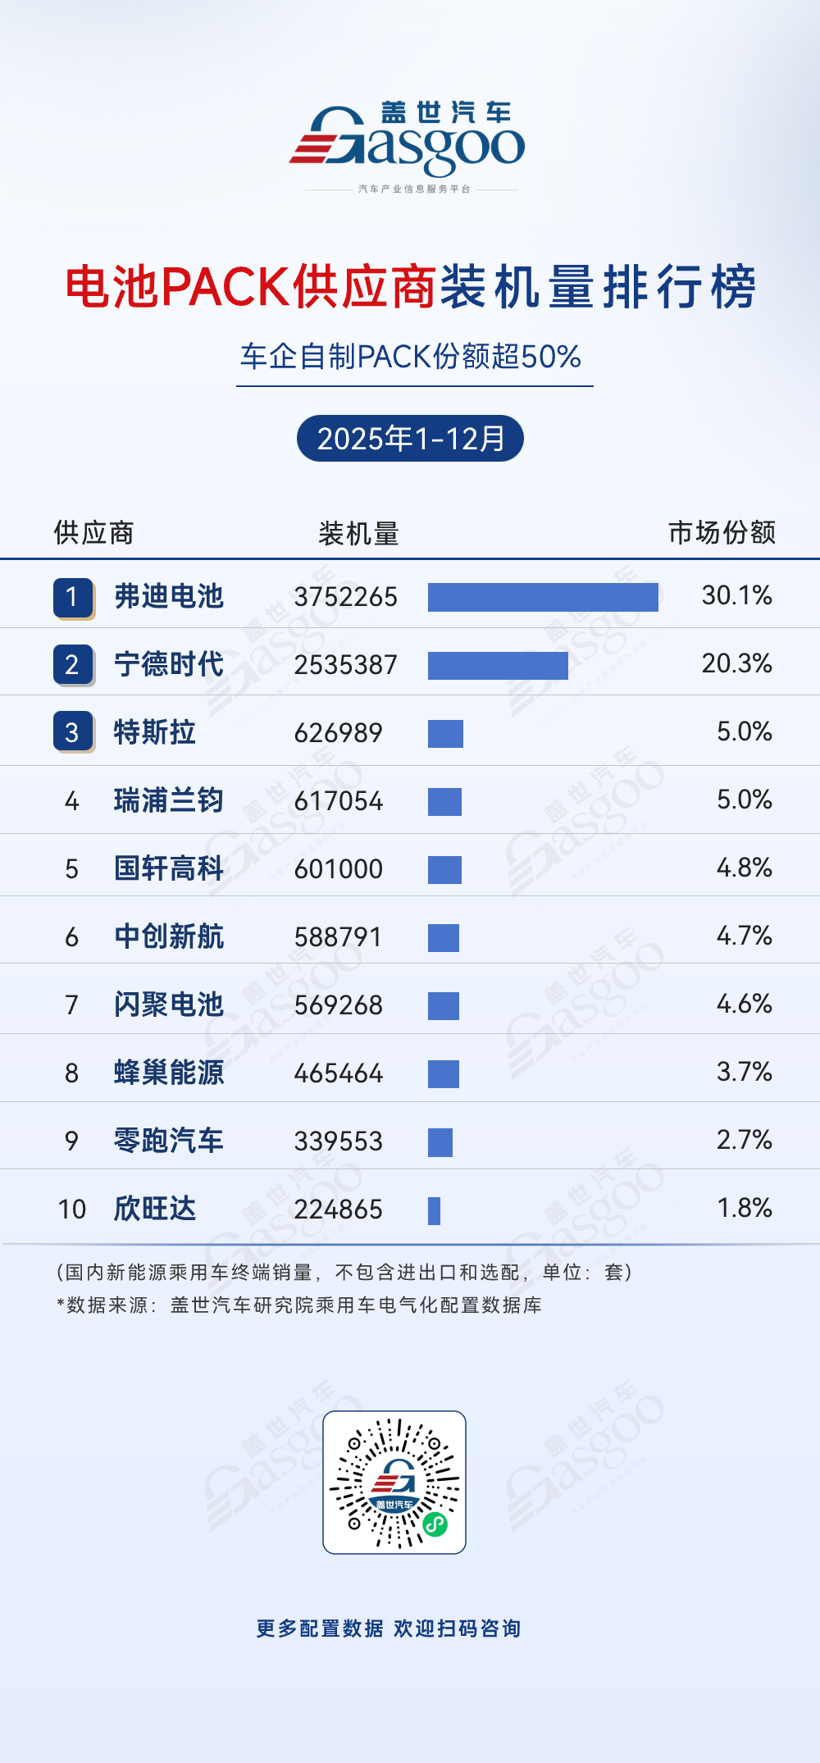
The Jan–Dec 2025 battery PACK market is characterized by dominance from in-house automaker production and high concentration among top suppliers. FinDreams Battery tops the list with a 30.1% share and 3,752,265 sets installed, driven largely by BYD's vertical integration capabilities; its in-house packs are perfectly tailored to its own vehicles' technical needs, creating an efficient supply chain loop. CATL follows with a 20.3% share and 2,535,387 sets, serving as the absolute leader among third-party suppliers by providing standardized PACK solutions to numerous mainstream automakers. The presence of automakers like Tesla and Leapmotor on the list reflects a strategy where top carmakers accelerate vertical integration to control core technology and cut costs. Meanwhile, companies like REPT and Gotion High-tech are growing steadily in niche segments, forming a competitive structure of "two giants + in-house automaker production + a supporting second tier."
BMS Supplier Installation Rankings
FinDreams Battery, Jan–Dec 2025 installation 3,804,962 sets, market share 30.5%.
CATL, Jan–Dec 2025 installation 2,336,054 sets, market share 18.7%.
LIGOO, Jan–Dec 2025 installation 1,789,747 sets, market share 14.4%.
UAES, Jan–Dec 2025 installation 958,028 sets, market share 7.7%.
Tesla, Jan–Dec 2025 installation 626,989 sets, market share 5.0%.
Leapmotor, Jan–Dec 2025 installation 444,249 sets, market share 3.6%.
Dr. Octopus, Jan–Dec 2025 installation 358,364 sets, market share 2.9%.
G-Pulse, Jan–Dec 2025 installation 313,752 sets, market share 2.5%.
VREMT, Jan–Dec 2025 installation 287,758 sets, market share 2.3%.
Shanghai Jieneng Automobile Technology, Jan–Dec 2025 installation 273,465 sets, market share 2.2%.
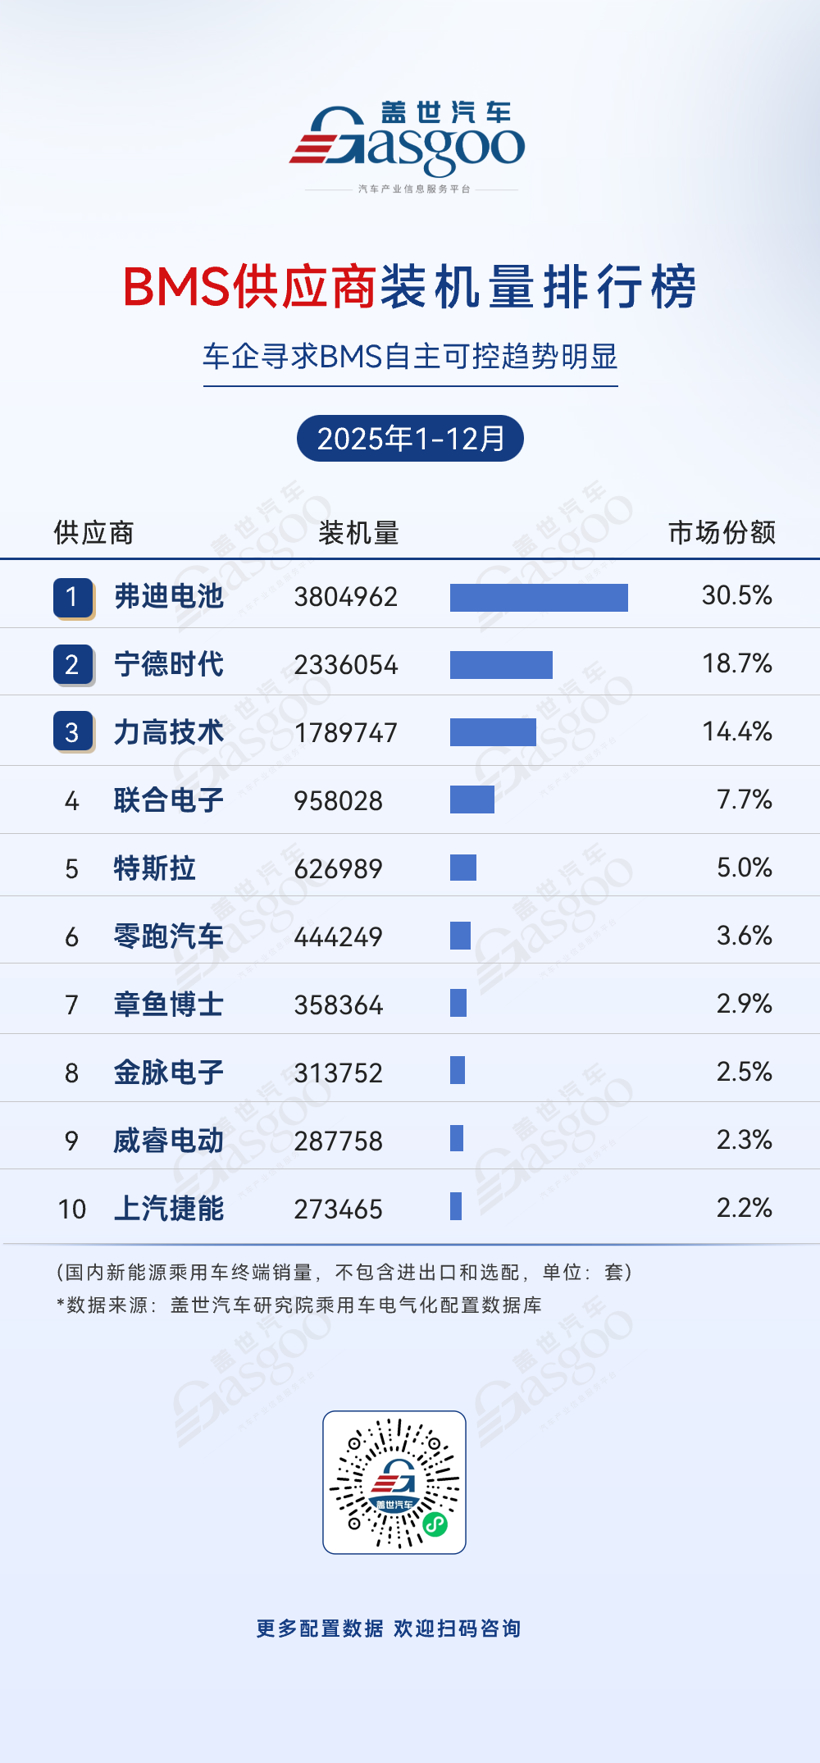
Based on Jan–Dec 2025 BMS installation data, the domestic market is dominated by vertical integration, accelerating self-sufficiency, and clear concentration among top players. FinDreams Battery holds the lead with a 30.5% share and 3,804,962 sets, thanks to BYD's full-industry-chain layout in BMS technology; its in-house systems are deeply adapted to its own vehicles, achieving efficient battery management coordination. CATL follows with an 18.7% share, serving as a core supplier for many automakers with mature solutions. LIGOO entered the top three with a 14.4% share, demonstrating its technical accumulation in the third-party BMS sector. The presence of automakers like Tesla, Leapmotor, and Shanghai Jieneng Automobile Technology confirms the industry trend of "carmakers seeking autonomous control over BMS."
Drive Motor Supplier Installation Rankings
FinDreams Power, Jan–Dec 2025 installation 3,811,205 sets, market share 25.6%.
Huawei Digital Power, Jan–Dec 2025 installation 1,065,760 sets, market share 7.2%.
InfiMotion, Jan–Dec 2025 installation 946,624 sets, market share 6.4%.
Inovance Automotive, Jan–Dec 2025 installation 835,231 sets, market share 5.6%.
Tesla, Jan–Dec 2025 installation 780,797 sets, market share 5.2%.
SVOLT Yichuang, Jan–Dec 2025 installation 531,654 sets, market share 3.6%.
UAES, Jan–Dec 2025 installation 530,020 sets, market share 3.6%.
NIO Power Technology, Jan–Dec 2025 installation 528,959 sets, market share 3.6%.
GLB Intelligence & Power, Jan–Dec 2025 installation 504,385 sets, market share 3.4%.
Saike Technology, Jan–Dec 2025 installation 445,061 sets, market share 3.0%.
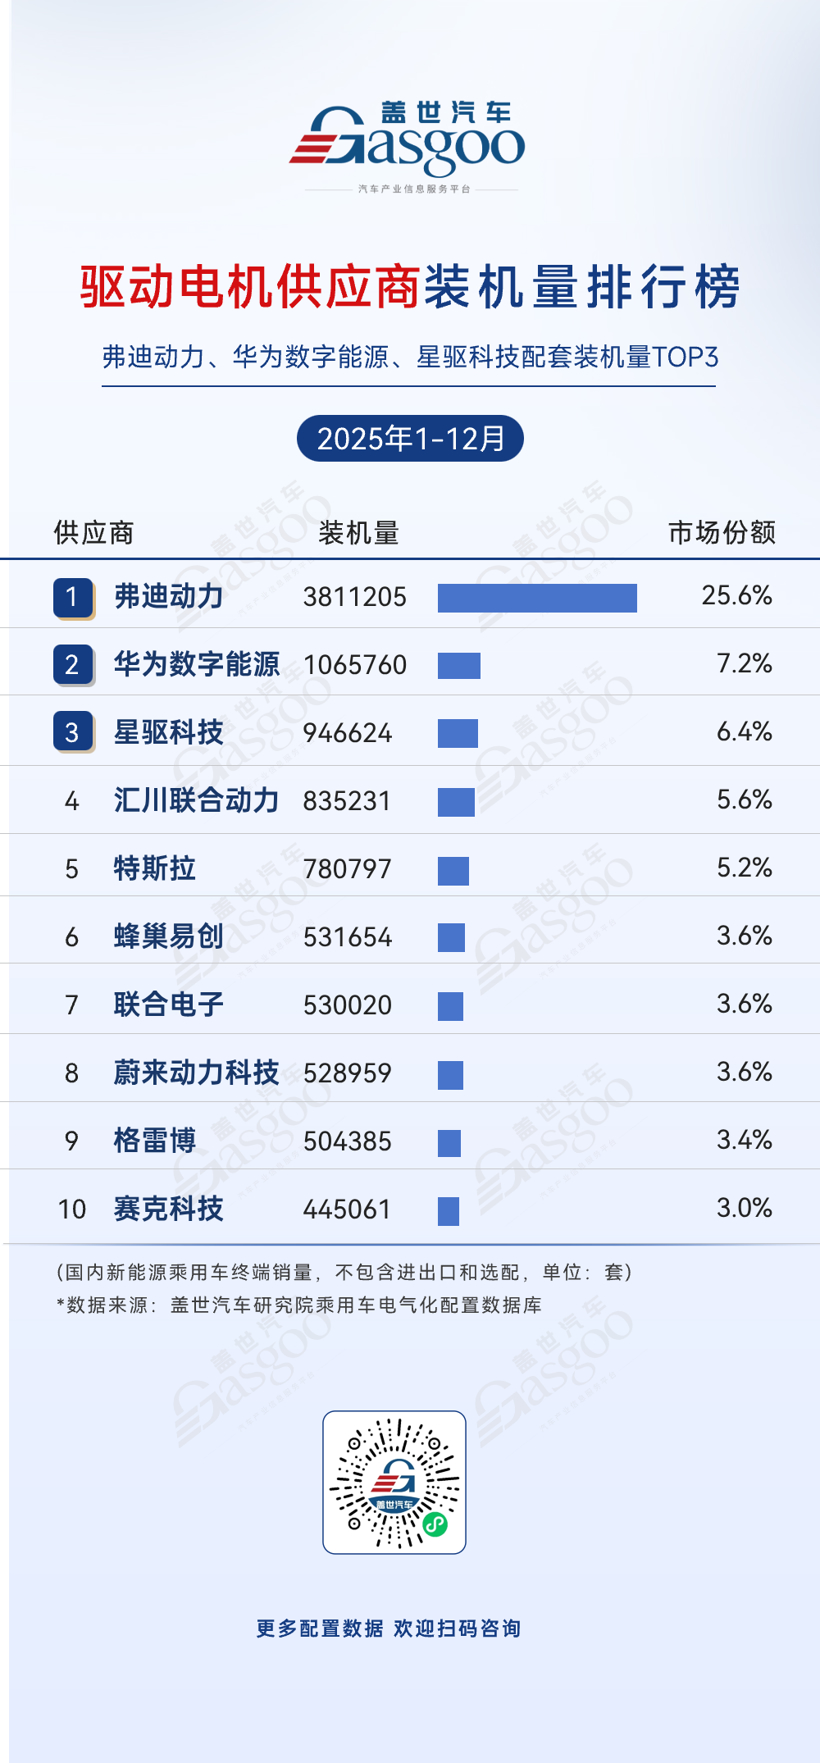
Regarding the Jan–Dec 2025 drive motor supplier landscape, FinDreams Power, Huawei Digital Power, and InfiMotion lead the installation rankings, forming the current first tier. FinDreams Power holds the top spot with a 25.6% market share and 3,811,205 sets installed for the year. Leveraging BYD's vertical integration of vehicles and powertrains, its drive motors are deeply coordinated with vehicle platforms, offering significant advantages in scaling and cost control. Professional suppliers like Huawei Digital Power, InfiMotion, and Inovance Automotive follow closely, continuously expanding their share with multiple automakers through technical accumulation in motor efficiency, power density, and system integration. Meanwhile, in-house supply systems from Tesla and NIO Power Technology have also made the top ranks, engaging in differentiated competition with third-party suppliers and jointly driving technological iteration and industry upgrades.
Motor Controller Supplier Installation Rankings
FinDreams Power, Jan–Dec 2025 installation 3,811,206 sets, market share 25.6%.
Inovance Automotive, Jan–Dec 2025 installation 1,442,833 sets, market share 9.7%.
Huawei Digital Power, Jan–Dec 2025 installation 1,070,134 sets, market share 7.2%.
Tesla, Jan–Dec 2025 installation 780,797 sets, market share 5.2%.
InfiMotion, Jan–Dec 2025 installation 658,859 sets, market share 4.4%.
UAES, Jan–Dec 2025 installation 570,443 sets, market share 3.8%.
NIO Power Technology, Jan–Dec 2025 installation 528,959 sets, market share 3.6%.
GLB Intelligence & Power, Jan–Dec 2025 installation 460,084 sets, market share 3.1%.
Jinhua Lingsheng Power Technology, Jan–Dec 2025 installation 429,114 sets, market share 2.9%.
Saike Technology, Jan–Dec 2025 installation 426,616 sets, market share 2.9%.
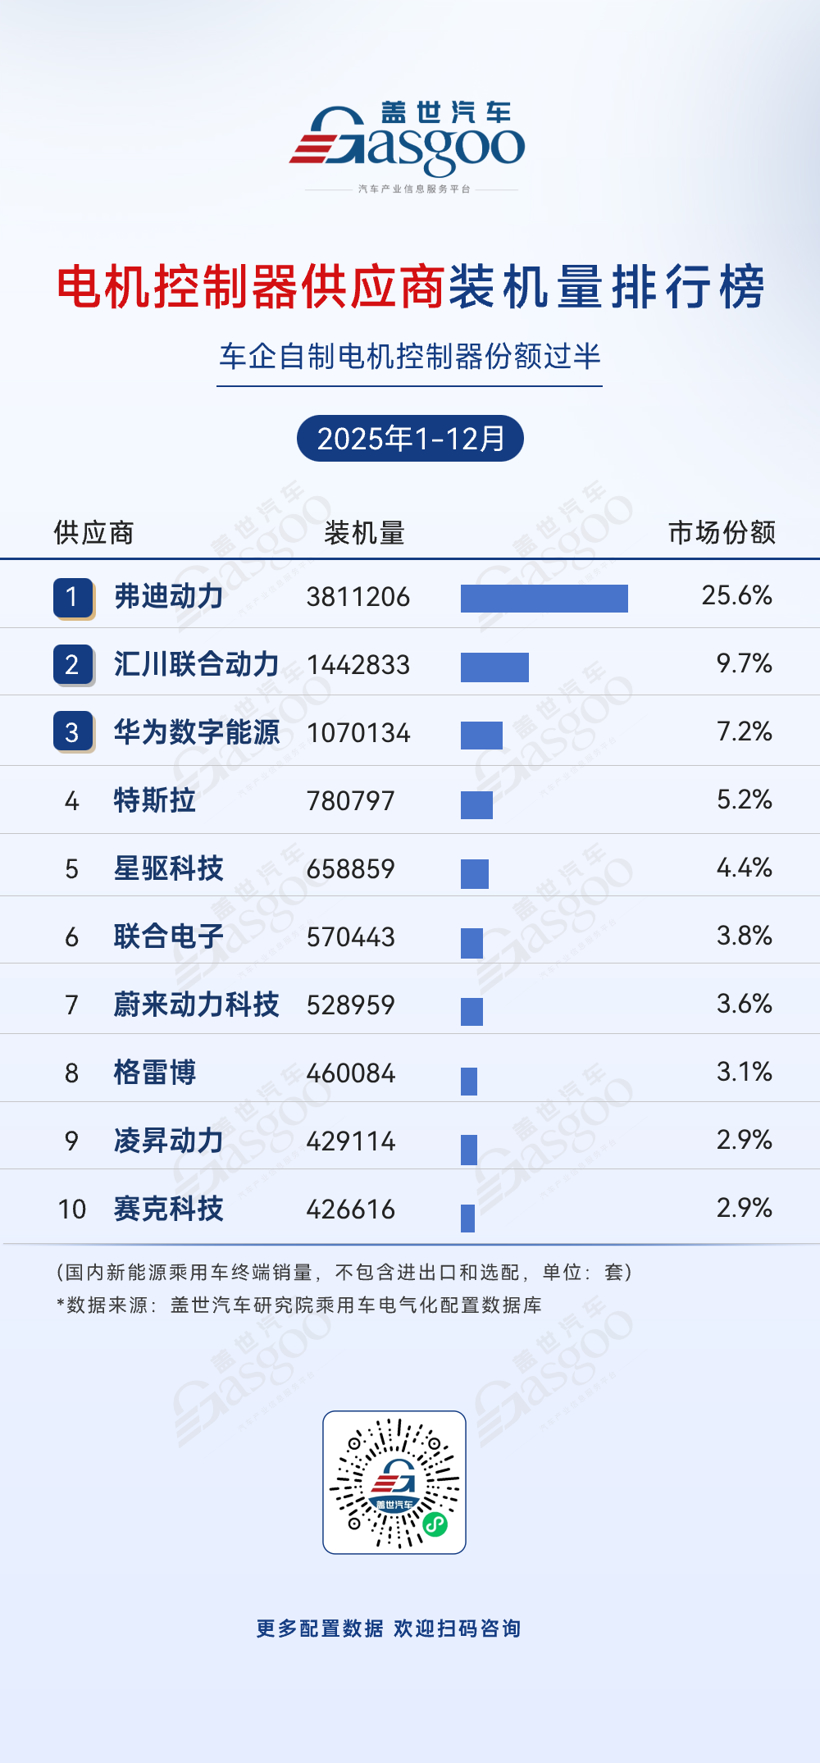
Jan–Dec 2025 motor controller installation data reveals that in-house production by automakers accounts for a significant proportion, highlighting a trend where OEMs strengthen self-sufficiency in core electronic control links. In terms of specific performance, FinDreams Power holds the lead with a 25.6% market share and 3,811,206 sets installed. Relying on BYD's vertical integration across vehicles, motors, and control systems, its motor controllers match its own vehicle platforms perfectly, offering clear advantages in scaling and cost control. Inovance Automotive and Huawei Digital Power rank in the second tier as professional suppliers, demonstrating strong third-party service capabilities. Meanwhile, in-house systems from Tesla and NIO Power Technology also rank high, creating a market structure developing in parallel with professional suppliers. They engage in differentiated competition across various technical paths and application scenarios, jointly driving the continuous iteration of motor controller technology.
Power Device (Drive) Supplier Installation Rankings
BYD Semiconductor, Jan–Dec 2025 installation 3,805,877 sets, market share 25.6%.
CRRC Times Semiconductor, Jan–Dec 2025 installation 1,859,795 sets, market share 12.5%.
Silan Microelectronics, Jan–Dec 2025 installation 1,286,511 sets, market share 8.6%.
United Nova Technology, Jan–Dec 2025 installation 1,277,020 sets, market share 8.6%.
Infineon, Jan–Dec 2025 installation 1,026,646 sets, market share 6.9%.
STMicroelectronics, Jan–Dec 2025 installation 799,922 sets, market share 5.4%.
UAES, Jan–Dec 2025 installation 783,953 sets, market share 5.3%.
StarPower, Jan–Dec 2025 installation 721,189 sets, market share 4.8%.
Leadrive Technology, Jan–Dec 2025 installation 648,693 sets, market share 4.4%.
GEENER, Jan–Dec 2025 installation 222,905 sets, market share 1.5%.
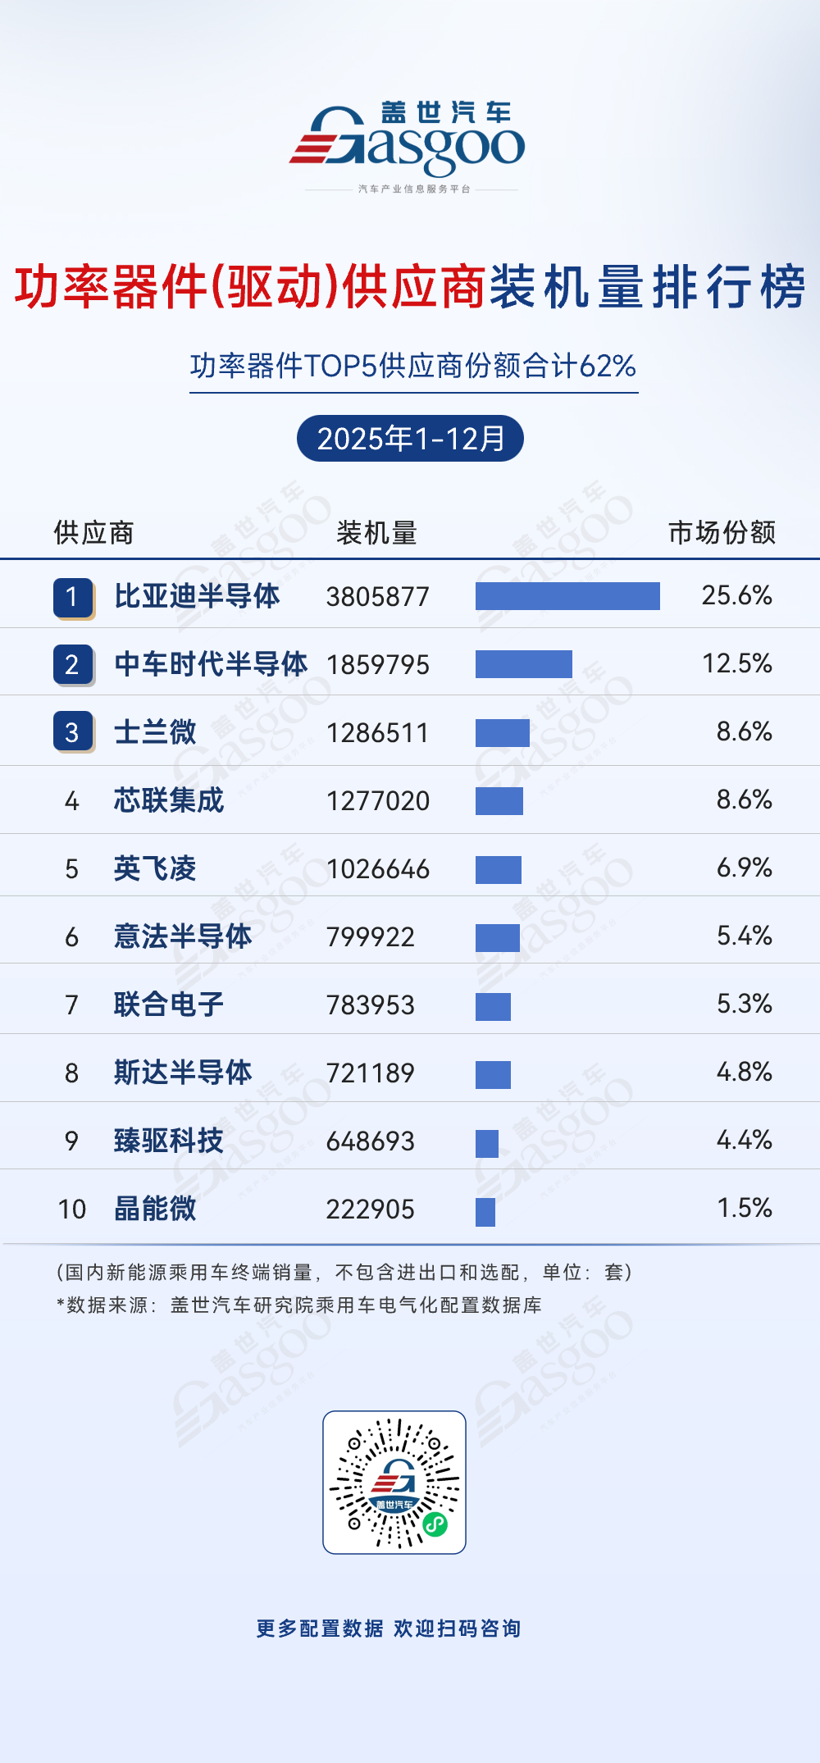
From Jan to Dec 2025, the domestic power device (drive) market presented a landscape dominated by local enterprises, with high concentration at the top and accelerating import substitution. The top five suppliers captured a combined 62% share. BYD Semiconductor held the lead with a 25.6% share and 3,805,877 sets installed. Local players like CRRC Times Semiconductor, Silan Microelectronics, and United Nova Technology followed closely, leveraging advantages in technology iteration, production scale, and cost control to seize market share. International giants like Infineon (6.9%) and STMicroelectronics (5.4%) still hold important positions, but their market space is being continuously squeezed by local firms—highlighting the breakthrough and rise of domestic power devices in automotive-grade applications.
OBC Supplier Installation Rankings
FinDreams Power, Jan–Dec 2025 installation 3,426,591 sets, market share 27.5%.
Vmax, Jan–Dec 2025 installation 2,303,908 sets, market share 18.5%.
EVTECH, Jan–Dec 2025 installation 1,119,888 sets, market share 9.0%.
SHINRY, Jan–Dec 2025 installation 1,088,751 sets, market share 8.7%.
Enpower, Jan–Dec 2025 installation 939,592 sets, market share 7.5%.
Huawei Digital Power, Jan–Dec 2025 installation 802,357 sets, market share 6.4%.
Sanmina, Jan–Dec 2025 installation 626,989 sets, market share 5.0%.
Megmeet, Jan–Dec 2025 installation 457,047 sets, market share 3.7%.
TC Charger, Jan–Dec 2025 installation 269,019 sets, market share 2.2%.
Inovance Automotive, Jan–Dec 2025 installation 248,699 sets, market share 2.0%.
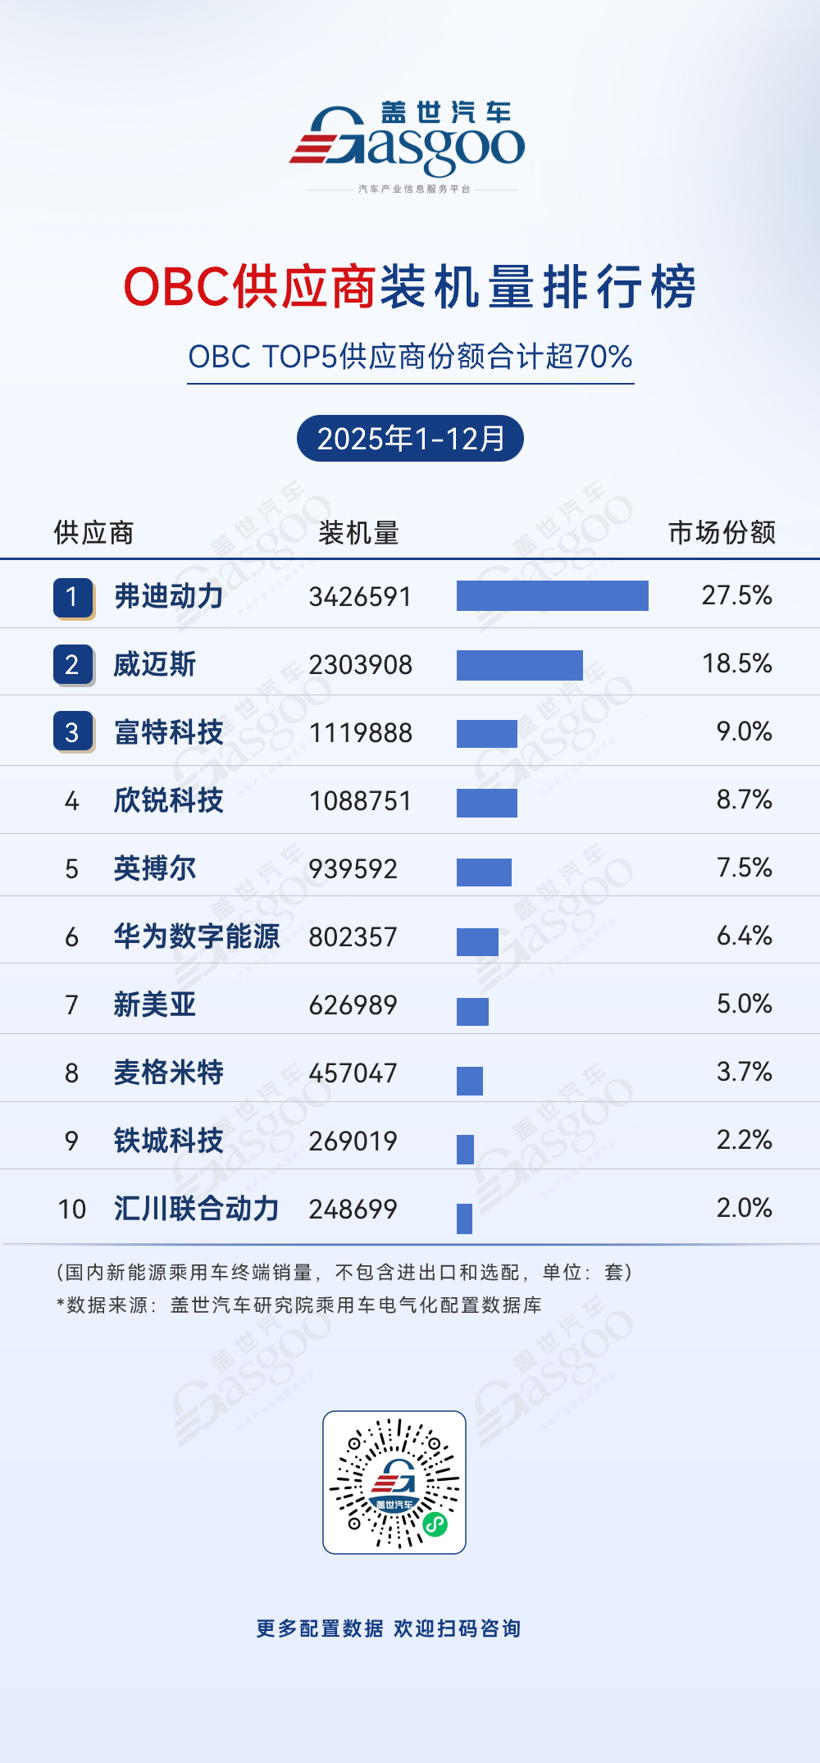
Jan–Dec 2025 OBC installation data shows a domestic market characterized by high concentration among top players, dominance by local firms, and distinct technological differentiation. FinDreams Power holds the top spot with a 27.5% share and 3,426,591 sets installed, benefiting from BYD's vertically integrated supply chain; its OBC products are deeply adapted to its own vehicles, forming an efficient supply loop. Vmax ranks second with an 18.5% share, serving as a core supplier for many mainstream automakers with mature third-party solutions. The top five suppliers account for over 70% of the market, reflecting a trend toward accelerated concentration. Companies like EVTECH and SHINRY are growing steadily in niche segments, confirming the technical accumulation and production capacity advantages of the local supply chain in the OBC sector.
Multi-in-One Main Drive System (BEV) Supplier Installation Rankings
FinDreams Power, Jan–Dec 2025 installation 1,604,425 sets, market share 23.8%.
Tesla, Jan–Dec 2025 installation 626,989 sets, market share 9.3%.
GLB Intelligence & Power, Jan–Dec 2025 installation 504,385 sets, market share 7.5%.
InfiMotion, Jan–Dec 2025 installation 364,469 sets, market share 5.4%.
Inovance Automotive, Jan–Dec 2025 installation 359,489 sets, market share 5.3%.
Jinhua Lingsheng Power Technology, Jan–Dec 2025 installation 341,705 sets, market share 5.1%.
NIO Power Technology, Jan–Dec 2025 installation 325,508 sets, market share 4.8%.
UAES, Jan–Dec 2025 installation 306,949 sets, market share 4.5%.
CRRC Times Electric, Jan–Dec 2025 installation 289,423 sets, market share 4.3%.
Deepal, Jan–Dec 2025 installation 199,356 sets, market share 3.0%.
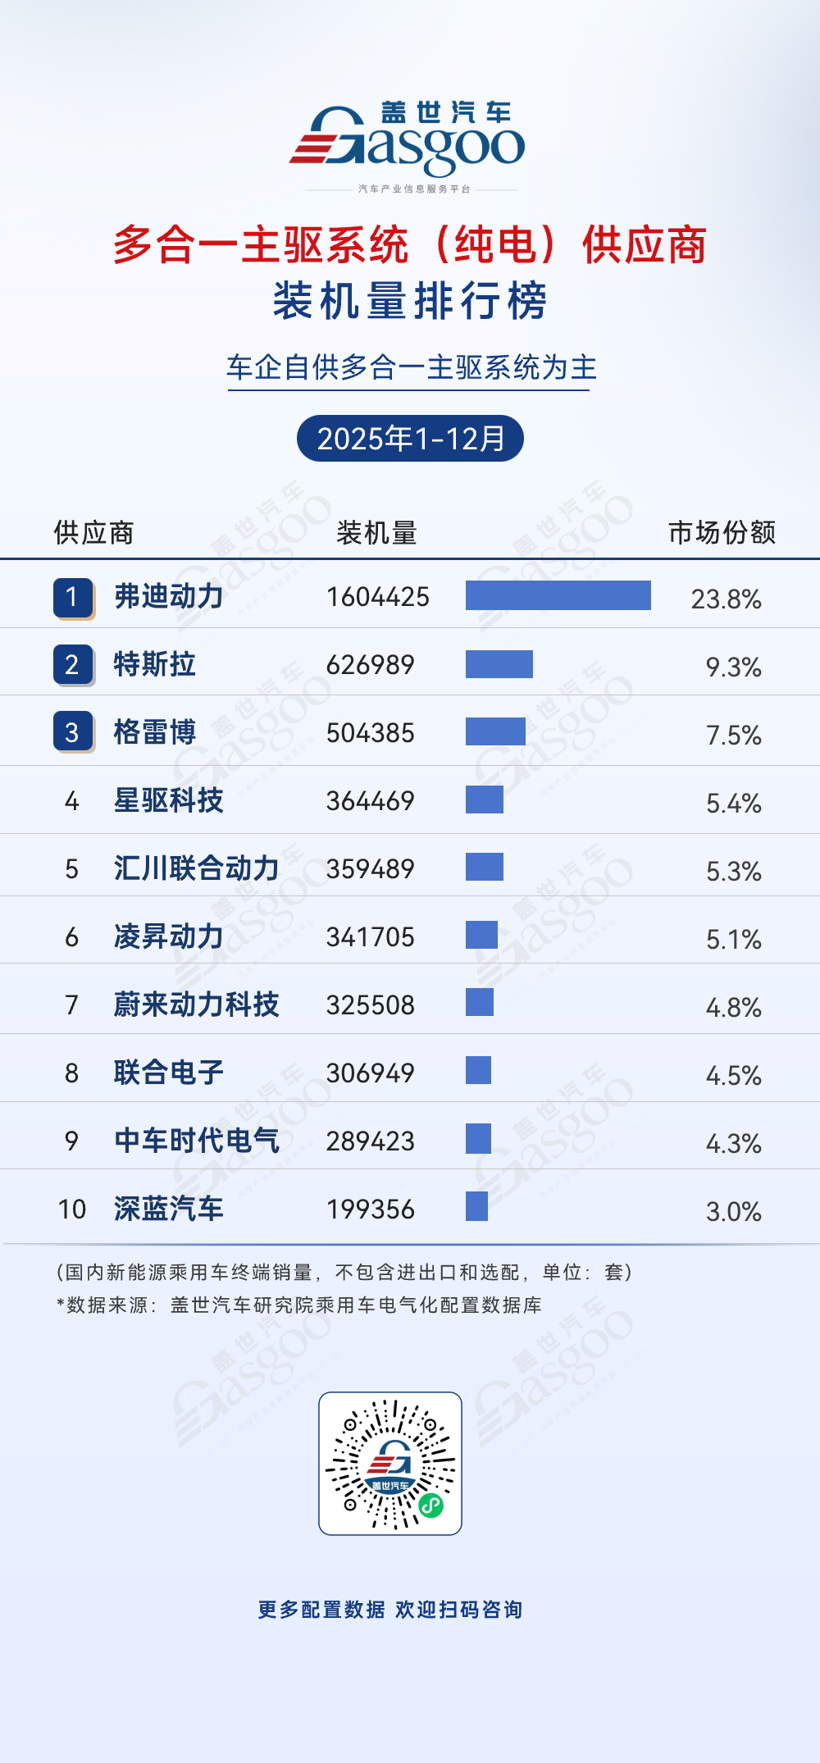
In 2025, the domestic multi-in-one main drive system (BEV) market formed a competitive landscape dominated by in-house automaker supply and high concentration among top manufacturers; the multi-in-one system is gradually becoming the mainstream electric drive solution. FinDreams Power ranked first with a 23.8% market share and 1,604,425 sets installed. Leveraging BYD's vertical integration in electric drive systems, its multi-in-one solution offers clear advantages in system integration, cost efficiency, and large-scale application. Tesla ranked second with a 9.3% share, maintaining strong competitiveness in performance and engineering maturity through continuous iteration of its self-developed electric drive system. Meanwhile, professional suppliers like GLB Intelligence & Power, InfiMotion, and Inovance Automotive entered the first tier, establishing differentiated advantages in customized development capabilities and continuing to secure supply contracts with various automakers.
Electric Compressor Supplier Installation Rankings
FinDreams Technology, Jan–Dec 2025 installation 3,238,799 sets, market share 26.0%.
Sanden Huayu Automotive Air-Conditioning, Jan–Dec 2025 installation 2,226,532 sets, market share 17.9%.
Aotecar, Jan–Dec 2025 installation 1,628,581 sets, market share 13.1%.
Welling, Jan–Dec 2025 installation 1,084,465 sets, market share 8.7%.
Highly, Jan–Dec 2025 installation 961,261 sets, market share 7.7%.
Zhongcheng New Energy, Jan–Dec 2025 installation 913,415 sets, market share 7.3%.
Chongqing Chaoli, Jan–Dec 2025 installation 318,367 sets, market share 2.6%.
Sanden, Jan–Dec 2025 installation 313,495 sets, market share 2.5%.
Hanon, Jan–Dec 2025 installation 282,475 sets, market share 2.3%.
Denso, Jan–Dec 2025 installation 228,263 sets, market share 1.8%.
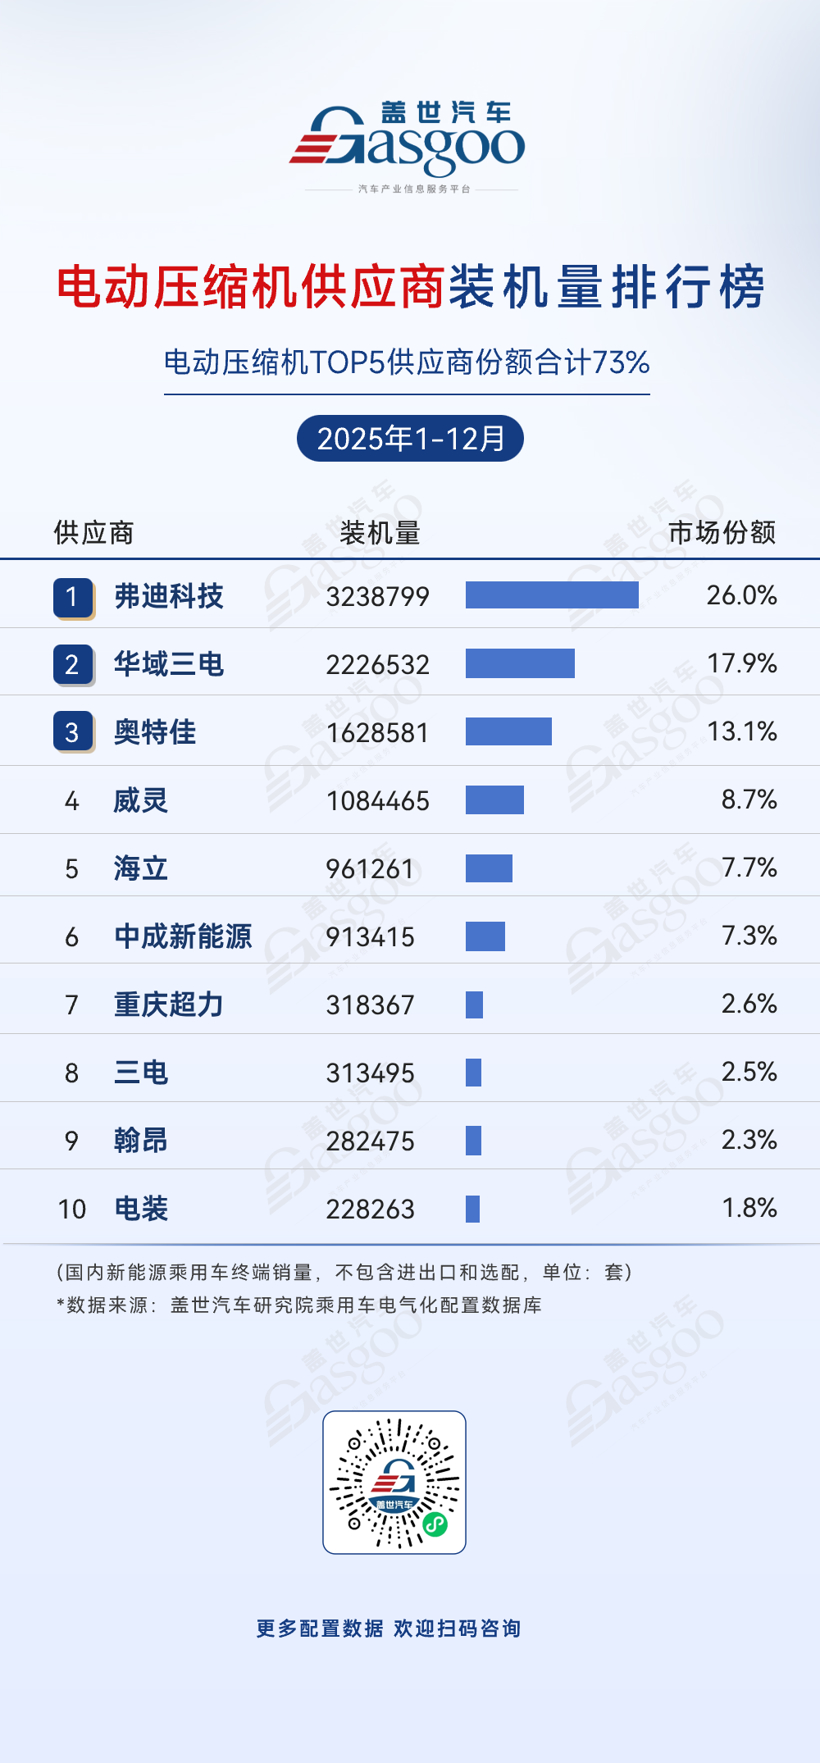
Jan–Dec 2025 electric compressor installation data reveals a domestic market defined by high concentration among top players, local enterprise dominance, and significant technological differentiation. FinDreams Technology holds the lead with a 26.0% share and 3,238,799 sets installed, primarily due to BYD's vertically integrated supply chain advantages. Local firms like Sanden Huayu Automotive Air-Conditioning and Aotecar follow closely, with the top five suppliers claiming a combined 73% share—reflecting the trend of market concentration accelerating toward the top. Companies like Welling and Highly are growing steadily in niche segments, confirming the technical accumulation and production capacity strengths of the local supply chain in electric compressors. International giants like Denso rank tenth with just a 1.8% share, further underscoring the competitiveness of local enterprises in cost control and response speed.


